Computer Applications
Answer
MS Excel offers various formatting features to improve the appearance of text. You can change the text alignment, font, color, size, style, etc. through the formatting effects available in MS Excel. The text formatting features are as follows:
- Font Styles and Sizes — Excel allows users to customize text with various font styles and sizes, facilitating emphasis on specific information.
- Bold, Italics, and Underline — Users can apply these formatting options to highlight or differentiate data, making it visually appealing and easier to read.
- Text Alignment — Excel provides options for aligning text within cells, such as left, right, center, or justified, improving the overall presentation of data.
- Cell Merging and Wrapping — Merging cells creates custom layouts, while text wrapping ensures that lengthy text fits within a cell, preventing overflow and maintaining a tidy appearance.
- Text Orientation — This feature is used to rotate the text through a specified angle. Tilting text at an angle can enhance the visibility of data labels and can contribute to the overall aesthetics of the spreadsheet.
Related Questions
What is Pie chart? Describe its features.
Explain the process of printing a complete workbook.
A chart displaying the subject wise attendance of four students and its source data have been given to you. Answer the following questions based on them:
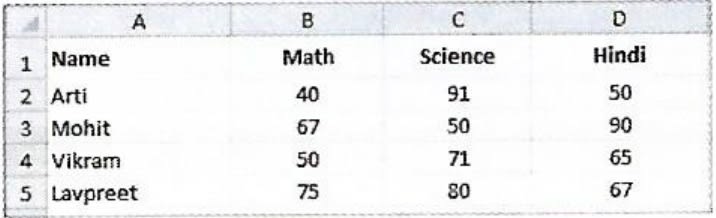
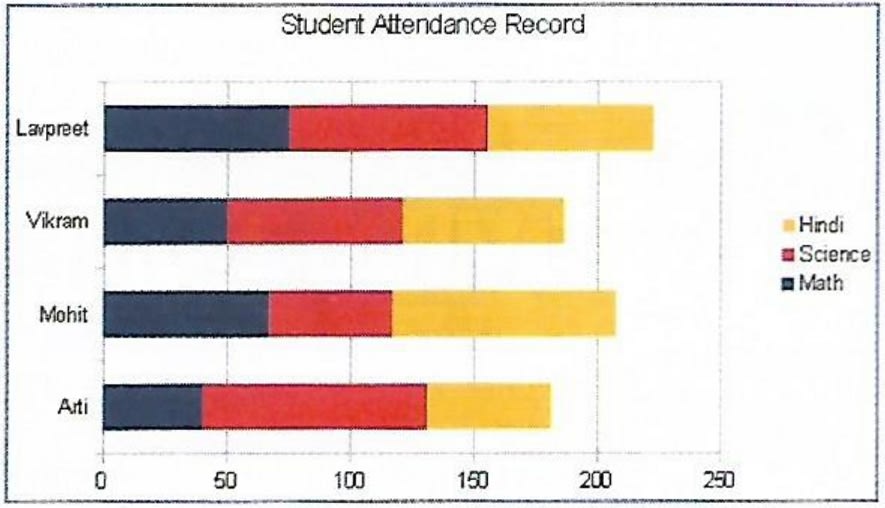
(i) Identify the Type of chart.
(ii) What is the title of the chart?
(iii) List the cell references of the three cell ranges used to produce this chart.
(iv) Suggest a suitable label for both category axis and value axis.
A table containing descriptions of different types of charts is given below. Names of some charts are given below within the bracket. Fill them in front of their respective descriptions and complete the assignment.
[Stock, Area, Bar, Pie, Line, and Radar]
Name Description It displays data in the form of long rectangular rods also called bars. This chart displays data in the form of a circle. It emphasizes the magnitude i.e., the volume of change over time. It is designed specifically for plotting data values related to stocks and shares. It is in the form of lines and is used to illustrate trends in data at equal intervals. It is a type of chart that resembles a spider net.