
What does the given picture represent in NumPy?
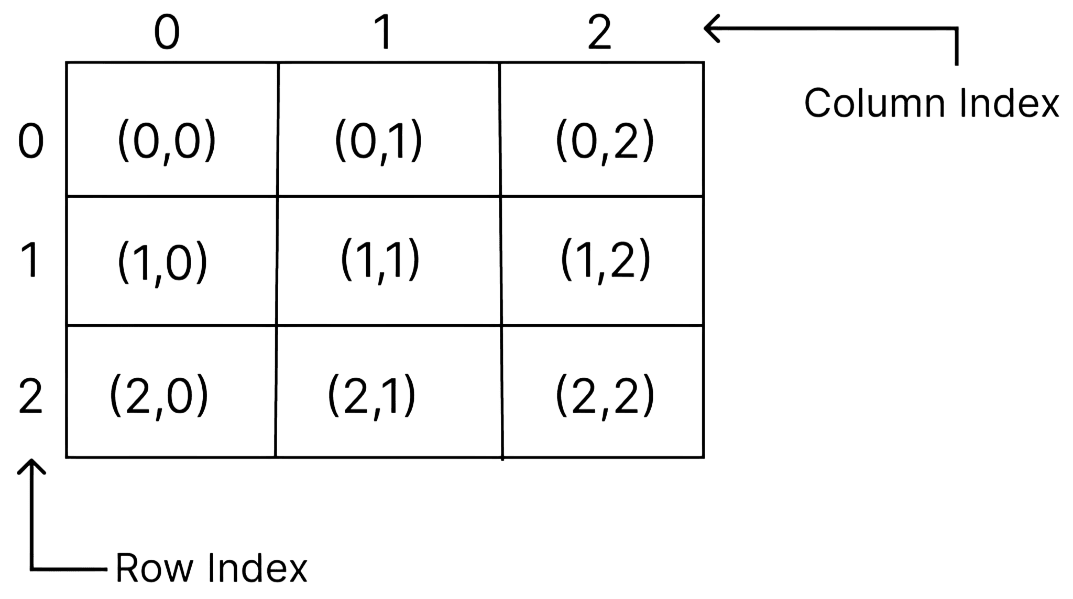
- 2D arrays
- 1D arrays
- 3D arrays
- None of these
Answer
2D arrays
Reason — The given figure shows both row index and column index, which indicates that elements are arranged in rows and columns. In NumPy, such an arrangement represents a two-dimensional (2D) array, where each element is accessed using two indices: one for the row and one for the column.
Which of the following is appropriate for Pandas?
- It is a function.
- It is a language.
- It is a library.
- It is a hardware.
Answer
It is a library.
Reason — Pandas is a software library developed by Wes McKinney for the Python programming language for data manipulation and analysis. It is an open-source Python library used for data structures and their operations.
Which of the following library uses the functionality of ndarray?
- math library
- NumPy library
- Pandas library
- statistics library
Answer
NumPy library
Reason — The ndarray is a component of the NumPy library and provides different functions to work with dimensional arrays.
A Series object can be created using:
- A sequence
- A ndarray
- A scalar value
- None of these
Answer
A sequence
Reason — A Series is a one-dimensional data structure and is created by passing a sequence of data values while defining the Series object.
In Python, ............... is also known as Numerical Python.
- NumPy
- SciPy
- Pandas
- None of these
Answer
NumPy
Reason — NumPy stands for Numerical Python, which is the expanded form of its name.
Pandas was developed by:
- Brendan Eich
- Guido Van Rossum
- Wes McKinney
- Travis Oliphant
Answer
Wes McKinney
Reason — Pandas is a Python software library developed by Wes McKinney for data manipulation and analysis.
Which of the following functions calculates the mean of a NumPy array arr?
- np.mean(arr)
- arr.mean()
- mean(arr)
- arr.avg()
Answer
np.mean(arr)
Reason — np.mean() is used to find the arithmetical mean or the average value of the elements in a NumPy array.
Syntax: np.mean(array)
Series in Pandas is a:
- One dimensional data structure
- Two-dimensional data structure
- Three-dimensional data structure
- None of these
Answer
One dimensional data structure
Reason — A Series in Pandas represents data along a single axis and is described as a single dimensional (1D) array.
The term 'Pandas' has been derived from:
- Pinned data
- Processed data
- Panel data
- Python data
Answer
Panel data
Reason — The term Pandas is derived from Panel Data, which refers to multi-dimensional structured data commonly used in statistics and econometrics.
Which of the following is used to install Pandas?
- -m pip install pandas
- --m pip install
- install pandas
- download pandas
Answer
-m pip install pandas
Reason — Pandas is installed using the PIP (Preferred Installer Program) with the command py -m pip install pandas, which installs the Pandas library in the Python environment.
Fill in the blanks:
- Data Visualisation is the process of creating, interpreting and comparing data into ................ contexts.
- Series is a one-dimensional data structure that contains a ................ set of data.
- ................ uses mainly two types of data structures such as Series and DataFrame.
- ................ is the alternate name given to the actual module which can be imported in Python program.
- ................ chart is used to plot the relationship or dependence of one variable on another to display changes or trends.
- ................ is a graphical representation of data where data is grouped into continuous number ranges in the form of vertical bars.
Answer
- Data Visualisation is the process of creating, interpreting and comparing data into visual contexts.
- Series is a one-dimensional data structure that contains a homogeneous set of data.
- Pandas uses mainly two types of data structures such as Series and DataFrame.
- Alias is the alternate name given to the actual module which can be imported in Python program.
- Line chart is used to plot the relationship or dependence of one variable on another to display changes or trends.
- Histogram is a graphical representation of data where data is grouped into continuous number ranges in the form of vertical bars.
Name the functions with the reference to NumPy.
- used to create an array with a range of values
- used to find the greatest value in a ndarray
- used to find the smallest value in a ndarray
- used to find the arithmetical mean of the elements in a ndarray
- used to find the mid value of a ndarray
Answer
- np.arange()
- np.max()
- np.min()
- np.mean()
- np.median()
Assertion (A): Python NumPy library is widely used library for carrying out mathematical operations involving dimensional arrays.
Reason (R): The term 'dimensional arrays' refers to as a sequence of mutable elements similar to the Python Lists.
Based on the above assertion and reasoning, choose an appropriate statement from the options given below:
- Both A and R are true and R is the correct explanation of A.
- Both A and R are true and R is not the correct explanation of A.
- A is true but R is false.
- A is false but R is true.
- Both A and R are false.
Answer
Both A and R are true and R is not the correct explanation of A.
Reason — Assertion (A) is true because NumPy is widely used for carrying out mathematical operations involving dimensional arrays. Reason (R) is also true because dimensional arrays are sequences of mutable elements similar to Python lists. However, R only explains the meaning of dimensional arrays and does not explain why NumPy is widely used for mathematical operations.
Pandas library has two primary data structures viz, Series and DataFrame that can handle the vast majority in various fields such as finance, statistics, etc. In Python, a library is available which is used for data visualisation, an essential component of Data Science.
With the above discussions, it is expected that the student must be confident to answer the following statements, as stated below:
(a) It is a two-dimensional (2D) structure in Pandas (similar to a NumPy 2D array) represented along two axes (i.e., X-axis and Y-axis).
(b) It is a Python library that allows the user to plot various two dimensional graph such as bar graph, line graph, etc.
(c) It is an important data structure of Pandas library which represents data along the x-axis like the structure 1D array.
Answer
(a) DataFrame
(b) Matplotlib
(c) Series
Write short notes on Line graph.
Answer
A line graph, also called a line chart, displays information as a series of data points connected by straight line segments. It is used to plot the relationship of one variable on another and to display changes or trends over time, making it ideal for continuously changing data. In Python, it is created using the plot() function by providing values for the X-axis and Y-axis, and the show() function is used to display the graph. The shape of a line graph is not necessarily a straight line from start to end, as it depends on the values plotted on the X-axis and Y-axis.
Write short notes on Bar graph.
Answer
A bar graph is one of the most popular ways to visualise data. It represents data using rectangular bars to clearly show comparisons between different categories, where the height or length of each bar corresponds to the value it represents. Bar graphs are commonly used for comparing categories and analysing changes over time. In data visualisation, bars can be displayed either vertically or horizontally. In Python, a bar graph is plotted using the bar() function for vertical bars or the barh() function for horizontal bars, and the show() function is used to display the graph.
Write short notes on Pie graph.
Answer
A pie graph is a basic and easy-to-understand technique of data visualisation represented in the form of a circular region. The circle is divided into slices or sectors, where each slice represents a category and shows its proportion of the whole. The total value of a pie graph is always considered to be 100%, which subtends an angle of 360 degrees. Pie graphs are useful for comparing different parts of a whole. In Python, a pie graph is plotted using the pie() function along with suitable data values and labels.
Write short notes on Scatter plot.
Answer
A scatter plot is a two-dimensional data visualisation plot that uses dots to represent values for two different variables. Each dot (marker) represents an observation, where its position shows the values on the X-axis and Y-axis. Scatter plots are used to determine the relationship between different data groups and to observe how a change in one variable affects another. In Python, a scatter plot is created using the scatter() function along with show() to display the graph.
Write short notes on Histogram.
Answer
A histogram is a graphical representation of data where values are grouped into continuous number ranges called class intervals or bins and displayed in the form of vertical bars. The horizontal axis represents the number ranges, while the vertical axis shows the frequency or number of observations. A histogram is used to represent the distribution of continuous or discrete data. In Python, a histogram is created using the hist() function along with show() to display the graph.
Write short notes on Series.
Answer
A Series is an important data structure of the Pandas library that represents data along a single axis and is known as a one-dimensional (1D) array. It contains a set of data values along with a corresponding set of indices, which may be integers or strings. The indices act as reference points to access the data values of the Series. A Series can be created using default indexing or custom indexing depending on the user’s requirement.
Write short notes on DataFrame.
Answer
A DataFrame is a two-dimensional data structure of the Pandas library that represents data in a tabular or matrix form using rows and columns. It is similar to a NumPy 2D array and is represented along two axes, namely the X-axis and Y-axis. A DataFrame uses two types of indices: row indices and column names, which may be numbers, letters, or strings. It can store heterogeneous data and its values and size are mutable, meaning they can be changed as required.
Write short notes on NumPy.
Answer
NumPy stands for Numerical Python and is a Python library used for carrying out mathematical operations involving dimensional arrays. The term dimensional arrays refers to a sequence of mutable elements similar to Python lists. NumPy works efficiently with N-dimensional arrays and provides powerful functions for fast mathematical operations. It is widely used in Python for numerical computations and array processing.
What do you mean by NumPy library in Python?
Answer
The NumPy library in Python is used for carrying out mathematical operations involving dimensional arrays. The term dimensional arrays refers to a sequence of mutable elements similar to Python lists. NumPy is widely used for fast mathematical operations and works efficiently with N-dimensional arrays.
Differentiate between 1D and 2D arrays.
Answer
Differences between between 1D and 2D arrays are:
| 1D Array | 2D Array |
|---|---|
| It is a one-dimensional array where elements are arranged along a single axis. | It is a two-dimensional array where elements are arranged in rows and columns. |
| Elements are accessed using a single index. | Elements are accessed using two indices (row index and column index). |
| It represents a simple linear collection of elements. | It represents a matrix or table-like structure. |
What is meant by module? Give an example.
Answer
A module is referred to as a piece of software which has a specific functionality. It is a file like Python program file that contains classes, functions and variables, and also includes executable code.
Example: math module
Write two features of Pandas library.
Answer
Two features of the Pandas library are:
It supports organising data into different forms such as Series and DataFrame.
Being integrated with the matplotlib library, it is capable of producing data in the form of graphs and charts for better analysis.
Is Pandas compatible with NumPy? Comment.
Answer
Yes, Pandas is compatible with NumPy. Pandas is an extension of the NumPy library and builds on NumPy's array capabilities. It internally uses the basic functionalities of NumPy, which allows efficient data manipulation and analysis using structured data.
Can Pandas work with NumPy arrays? Explain.
Answer
Yes, Pandas can work with NumPy arrays. Pandas is an extension of the NumPy library and builds on NumPy's array capabilities. It internally uses the basic functionalities of NumPy, which allows Pandas to perform data manipulation and analysis efficiently using NumPy arrays.
What are the features of NumPy library?
Answer
The features of the NumPy library are:
- It works easily with N-dimensional arrays.
- It uses powerful functions to work with arrays.
- It uses software tools for integrating Python with C/C++.
- It is capable of working with Fourier transformation, linear algebra and random numbers.
What is data visualisation? How is it useful?
Answer
Data Visualisation is the process of communicating and translating data and information into visual contexts and to make data easier for the human brain to understand. It communicates complex ideas more clearly and thus making it easier for the user to identify the analysis of logical patterns.
Usefulness of Data Visualisation:
- It communicates the information clearly and efficiently to the users.
- It displays the input data through graphical representations using different charts.
- It helps the users in analysing a large amount of data in a simpler way.
- It supports by finding incorrect, corrupted or missing values.
- It makes complex data more accessible, understandable and usable.
Explain mean in the context of basic statistics in NumPy.
Answer
In NumPy, mean refers to the arithmetical mean or the average value of the elements in an array. It is calculated by adding all the elements of the array and dividing the sum by the total number of elements. The mean always results in a float type value. In NumPy, the mean is calculated using the np.mean() function.
Explain median in the context of basic statistics in NumPy.
Answer
In NumPy, median refers to the mid value of an array. The median is calculated only after sorting the values of the array. If there is one middle value, that value is the median. If there are two middle values, the average of the two middle values is taken as the median. The median always results in a float type value. In NumPy, the median is calculated using the np.median() function.
Create a NumPy ndarray object by using the array() function storing values: [12, 34, 22, 30, 26, 18, 20, 24, 42, 10]
Using the above values, write Python codes to perform the following tasks:
(a) mean of the array object
(b) smallest element of the array object
(c) greatest element of the array object
Answer
# creating a NumPy ndarray object
import numpy as np

arr = np.array([12, 34, 22, 30, 26, 18, 20, 24, 42, 10])
print("Elements present in NumPy array:", arr)

# (a) mean of the array
mean_value = np.mean(arr)
print("Mean of the array:", mean_value)

# (b) smallest element of the array
min_value = np.min(arr)
print("Smallest element of the array:", min_value)

# (c) greatest element of the array
max_value = np.max(arr)
print("Greatest element of the array:", max_value)Elements present in NumPy array: [12 34 22 30 26 18 20 24 42 10]
Mean of the array: 23.8
Smallest element of the array: 10
Greatest element of the array: 42