
The weight of 50 workers is given below :
| Weight (in kg) | No. of workers |
|---|---|
| 50 - 60 | 4 |
| 60 - 70 | 7 |
| 70 - 80 | 11 |
| 80 - 90 | 14 |
| 90 - 100 | 6 |
| 100 - 110 | 5 |
| 110 - 120 | 3 |
Draw an ogive of the given distribution using a graph sheet. Take 2 cm = 10 kg on one axis and 2 cm = 5 workers along the other axis. Use a graph to estimate the following :
(i) the upper and lower quartiles.
(ii) if weighing 95 kg and above is considered overweight find the number of workers who are overweight.
Answer
- The cumulative frequency table for the given continuous distribution is :
| Weight (in kg) | No. of workers | Cumulative frequency |
|---|---|---|
| 50 - 60 | 4 | 4 |
| 60 - 70 | 7 | 11 |
| 70 - 80 | 11 | 22 |
| 80 - 90 | 14 | 36 |
| 90 - 100 | 6 | 42 |
| 100 - 110 | 5 | 47 |
| 110 - 120 | 3 | 50 |
Take 1 cm along x-axis = 10 kg
Take 1 cm along y-axis = 5 (workers)
Since, scale on x-axis starts at 50, a kink is shown near the origin on x-axis to indicate that the graph is drawn to scale beginning at 50.
Plot the points (60, 4), (70, 11), (80, 22), (90, 36), (100, 42), (110, 47) and (120, 50) representing upper class limits and the respective cumulative frequencies.
Also plot the point representing lower limit of the first class i.e. 50 - 60.

- Join these points by a freehand drawing.
The required ogive is shown in figure above.
(i) To find lower quartile :
Let A be the point on y-axis representing frequency = = 12.5
Through A, draw a horizontal line to meet the ogive at P. Through P, draw a vertical line to meet the x-axis at M. The abscissa of the point M represents 71 kg.
To find upper quartile :
Let B be the point on y-axis representing frequency = = 37.5
Through B, draw a horizontal line to meet the ogive at Q. Through Q, draw a vertical line to meet the x-axis at N. The abscissa of the point N represents 93 kg.
Hence, lower quartile = 71 kg and upper quartile = 93 kg.
(ii) Let O be the point on x-axis representing 95 kg. Through O draw a vertical line to meet the ogive R. Through R, draw a horizontal line to meet the y-axis at point C. The ordinate of the point C represents 39.
So, the number of people whose weight is less than 95 kg = 39. So, overweight people = 50 - 39 = 11 kg.
Hence, the number of workers who are overweight are 11.
The table shows the distribution of scores obtained by 160 shooters in a shooting competition. Use a graph sheet and draw an ogive for the distribution.
(Take 2 cm = 10 scores on the x-axis and 2 cm = 20 shooters on the y-axis)
| Scores | No. of shooters |
|---|---|
| 0 - 10 | 9 |
| 10 - 20 | 13 |
| 20 - 30 | 20 |
| 30 - 40 | 26 |
| 40 - 50 | 30 |
| 50 - 60 | 22 |
| 60 - 70 | 15 |
| 70 - 80 | 10 |
| 80 - 90 | 8 |
| 90 - 100 | 7 |
Use your graph to estimate the following :
(i) The median.
(ii) The inter quartile range.
(iii) The number of shooters who obtained a score of more than 85%.
Answer
- The cumulative frequency table for the given continuous distribution is :
| Scores | No. of shooters | Cumulative frequency |
|---|---|---|
| 0 - 10 | 9 | 9 |
| 10 - 20 | 13 | 22 |
| 20 - 30 | 20 | 42 |
| 30 - 40 | 26 | 68 |
| 40 - 50 | 30 | 98 |
| 50 - 60 | 22 | 120 |
| 60 - 70 | 15 | 135 |
| 70 - 80 | 10 | 145 |
| 80 - 90 | 8 | 153 |
| 90 - 100 | 7 | 160 |
Take 2 cm along x-axis = 10 scores
Take 2 cm along y-axis = 20 (shooters)
Plot the points (10, 9), (20, 22), (30, 42), (40, 68), (50, 98), (60, 120), (70, 135), (80, 145), (90, 153) and (100, 160) representing upper class limits and the respective cumulative frequencies.
Also plot the point representing lower limit of the first class i.e. 0 - 10.Join these points by a freehand drawing.
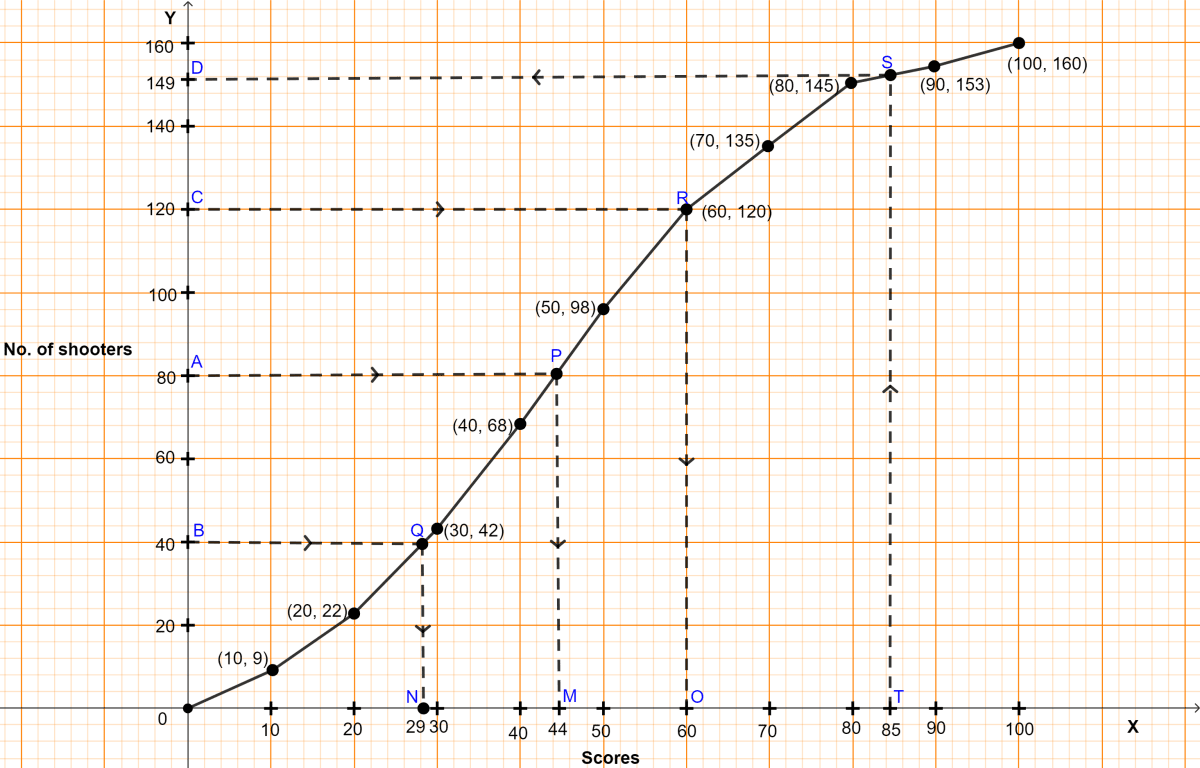
The required ogive is shown in figure above.
(i) Here, n (no. of students) = 160.
To find the median :
Let A be the point on y-axis representing frequency = = 80.
Through A draw a horizontal line to meet the ogive at P. Through P, draw a vertical line to meet the x-axis at M. The abscissa of the point M represents 44.
Hence, the required median score = 44.
(ii) To find lower quartile :
Let B be the point on y-axis representing frequency = = 40
Through B, draw a horizontal line to meet the ogive at Q. Through Q, draw a vertical line to meet the x-axis at N. The abscissa of the point N represents 29.
To find upper quartile :
Let C be the point on y-axis representing frequency = = 120
Through C, draw a horizontal line to meet the ogive at R. Through R, draw a vertical line to meet the x-axis at O. The abscissa of the point O represents 60.
Inter quartile range = Upper quartile - Lower quartile = 60 - 29 = 31.
Hence, the inter quartile range = 31 scores.
(iii) Total marks = 100.
So, more than 85% marks mean more than 85 marks.
Let T be the point on x-axis representing marks = 85.
Through T, draw a vertical line to meet the ogive at S. Through S, draw a horizontal line to meet the y-axis at D. The ordinate of the point D represents 149.
Students who have scored less than 85% = 149.
So, students scoring more than 85% = Total students - Students who have scored less = 160 - 149 = 11.
Hence, there are 11 shooters who obtained a score of more than 85%.
The daily wages of 80 workers in a project are given below :
| Wages (in ₹) | No. of workers |
|---|---|
| 400 - 450 | 2 |
| 450 - 500 | 6 |
| 500 - 550 | 12 |
| 550 - 600 | 18 |
| 600 - 650 | 24 |
| 650 - 700 | 13 |
| 700 - 750 | 5 |
Use a graph paper to draw an ogive for the above distribution. (Use a scale of 2 cm = ₹ 50 on x-axis and 2 cm = 10 workers on y-axis). Use your ogive to estimate :
(i) the median wage of the workers.
(ii) the lower quartile wage of the workers.
(iii) the number of workers who earn more than ₹625 daily.
Answer
- The cumulative frequency table for the given continuous distribution is :
| Wages (in ₹) | No. of workers | Cumulative frequency |
|---|---|---|
| 400 - 450 | 2 | 2 |
| 450 - 500 | 6 | 8 |
| 500 - 550 | 12 | 20 |
| 550 - 600 | 18 | 38 |
| 600 - 650 | 24 | 62 |
| 650 - 700 | 13 | 75 |
| 700 - 750 | 5 | 80 |
Take 2 cm along x-axis = 50 rupees
Take 1 cm along y-axis = 10 workers
Since, scale on x-axis starts at 400, a kink is shown near the origin on x-axis to indicate that the graph is drawn to scale beginning at 400.
Plot the points (450, 2), (500, 8), (550, 20), (600, 38), (650, 62), (700, 75) and (750, 80) representing upper class limits and the respective cumulative frequencies.
Also plot the point representing lower limit of the first class i.e. 400 - 450.Join these points by a freehand drawing.
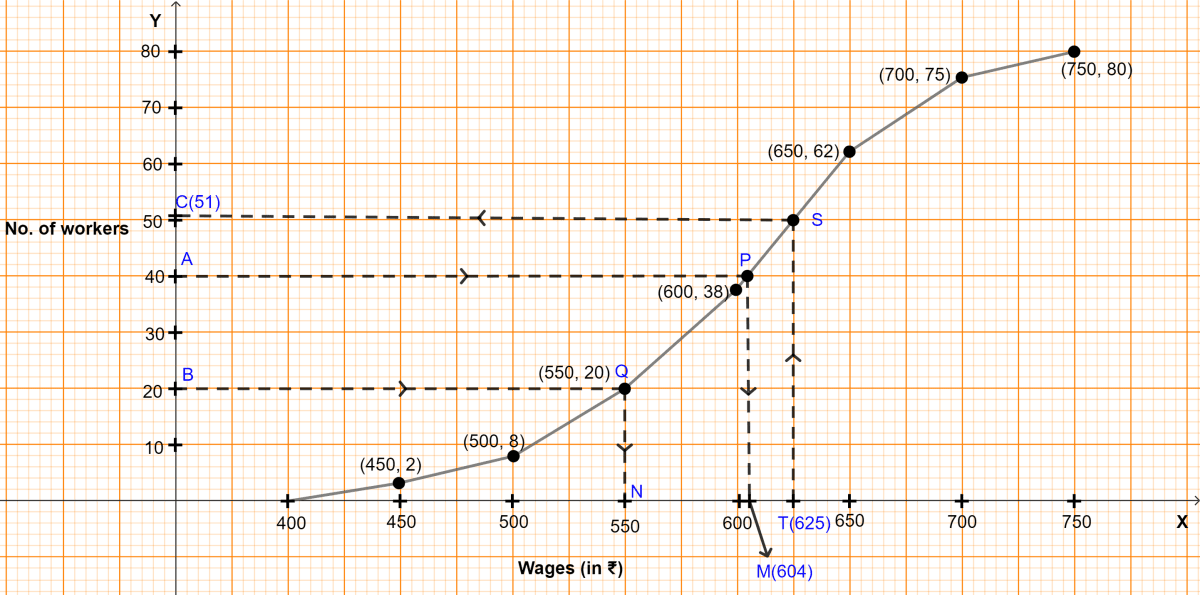
The required ogive is shown in figure above.
(i) Here, n (no. of students) = 80.
To find the median :
Let A be the point on y-axis representing frequency = = 40.
Through A draw a horizontal line to meet the ogive at P. Through P, draw a vertical line to meet the x-axis at M. The abscissa of the point M represents 604.
Hence, the required median wage = ₹604.
(ii) To find lower quartile :
Let B be the point on y-axis representing frequency = = 20
Through B, draw a horizontal line to meet the ogive at Q. Through Q, draw a vertical line to meet the x-axis at N. The abscissa of the point N represents 550.
Hence, lower quartile wage = ₹550.
(iii) Let T be the point on x-axis representing wage = ₹625.
Through T, draw a vertical line to meet the ogive at S. Through S, draw a horizontal line to meet the y-axis at C. The ordinate of the point C represents 51.
Workers who earn less than ₹625 = 51.
So, workers earning more than ₹625 = Total workers - workers who earn less than ₹625 = 80 - 51 = 29.
Hence, there are 29 workers earning more than ₹625 daily.
Marks obtained by 200 students in an examination are given below :
| Marks | No. of students |
|---|---|
| 0 - 10 | 5 |
| 10 - 20 | 11 |
| 20 - 30 | 10 |
| 30 - 40 | 20 |
| 40 - 50 | 28 |
| 50 - 60 | 37 |
| 60 - 70 | 40 |
| 70 - 80 | 29 |
| 80 - 90 | 14 |
| 90 - 100 | 6 |
Draw an ogive for the given distribution taking 2 cm = 10 marks on one axis and 2 cm = 20 students on the other axis. Using the graph, determine :
(i) The median marks
(ii) The number of students who failed if minimum marks required to pass is 40.
(iii) If scoring 85 and more marks is considered as grade one, find the number of students who secured grade one in the examination.
Answer
- The cumulative frequency table for the given continuous distribution is :
| Marks | No. of students | Cumulative frequency |
|---|---|---|
| 0 - 10 | 5 | 5 |
| 10 - 20 | 11 | 16 |
| 20 - 30 | 10 | 26 |
| 30 - 40 | 20 | 46 |
| 40 - 50 | 28 | 74 |
| 50 - 60 | 37 | 111 |
| 60 - 70 | 40 | 151 |
| 70 - 80 | 29 | 180 |
| 80 - 90 | 14 | 194 |
| 90 - 100 | 6 | 200 |
Take 1 cm along x-axis = 10 scores
Take 1 cm along y-axis = 20 (students)
Plot the points (10, 5), (20, 16), (30, 26), (40, 46), (50, 74), (60, 111), (70, 151), (80, 180), (90, 194) and (100, 200) representing upper class limits and the respective cumulative frequencies.
Also plot the point representing lower limit of the first class i.e. 0 - 10.Join these points by a freehand drawing.
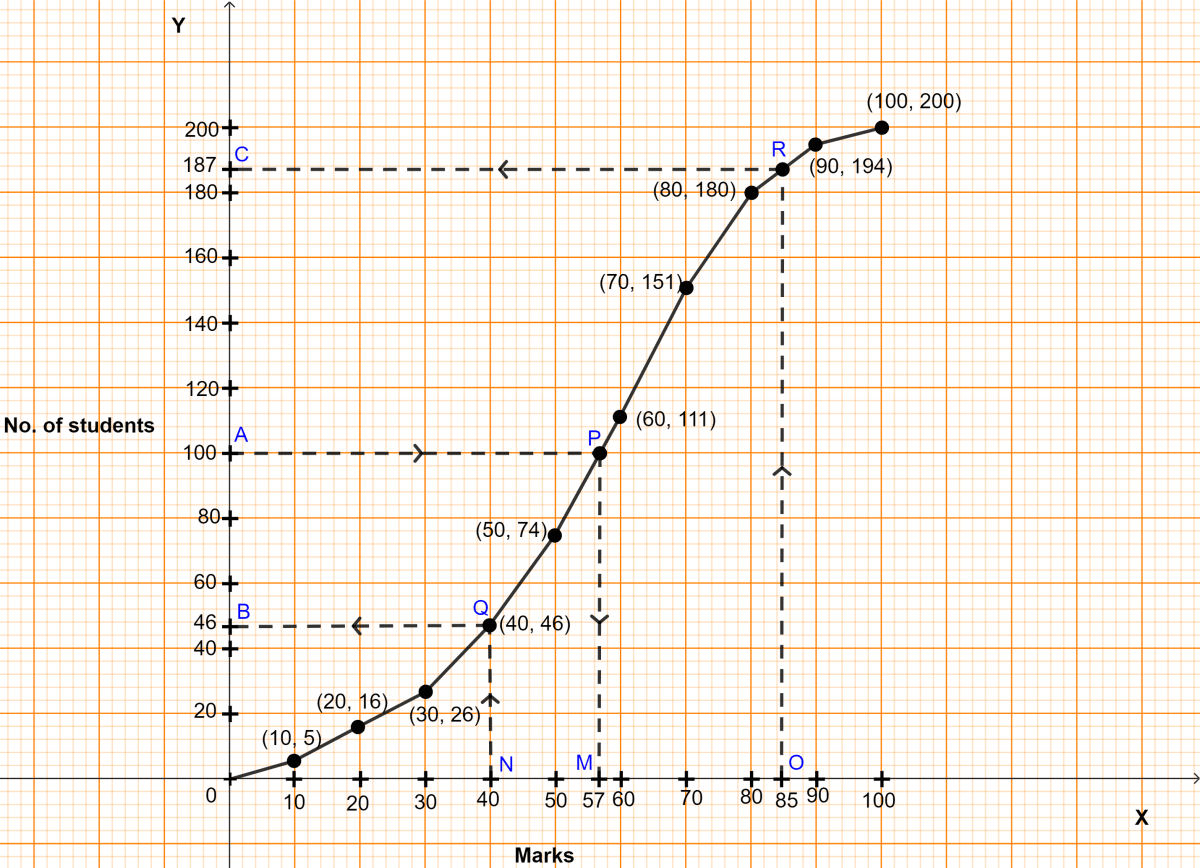
The required ogive is shown in figure above.
(i) Here, n (no. of students) = 200.
To find the median :
Let A be the point on y-axis representing frequency = = 100.
Through A draw a horizontal line to meet the ogive at P. Through P, draw a vertical line to meet the x-axis at M. The abscissa of the point M represents 57.
Hence, the required median marks = 57.
(ii) Let N be the point on x-axis representing marks = 40.
Through N, draw a vertical line to meet the ogive at Q. Through Q, draw a horizontal line to meet the y-axis at B. The ordinate of the point B represents 46.
Students who scored less than 40 = 46.
Hence, 46 students failed in the examination.
(iii) Let O be the point on x-axis representing marks = 85.
Through O, draw a vertical line to meet the ogive at R. Through R, draw a horizontal line to meet the y-axis at C. The ordinate of the point C represents 187.
Students who scored less than 85 = 187.
So, students scoring more than 85 = Total students - students scoring less than 85 = 200 - 187 = 13.
Hence, 13 students secured grade one in examination.
Use graph paper for this question.
A survey regarding height (in cm) of 60 boys belonging to class 10 of a school was conducted. The following data was recorded :
| Height (in cm) | No. of boys |
|---|---|
| 135 - 140 | 4 |
| 140 - 145 | 8 |
| 145 - 150 | 20 |
| 150 - 155 | 14 |
| 155 - 160 | 7 |
| 160 - 165 | 6 |
| 165 - 170 | 1 |
Taking 2 cm = height of 10 cm on one axis and 2 cm = 10 boys along the other axis, draw an ogive of the above distribution. Use the graph to estimate the following :
(i) median
(ii) lower quartile
(iii) if above 158 is considered as the tall boy of the class, find the number of boys in the class who are tall.
Answer
- The cumulative frequency table for the given continuous distribution is :
| Height (in cm) | No. of boys | Cumulative frequency |
|---|---|---|
| 135 - 140 | 4 | 4 |
| 140 - 145 | 8 | 12 |
| 145 - 150 | 20 | 32 |
| 150 - 155 | 14 | 46 |
| 155 - 160 | 7 | 53 |
| 160 - 165 | 6 | 59 |
| 165 - 170 | 1 | 60 |
Take 2 cm along x-axis = 5 cm
Take 2 cm along y-axis = 10 (boys)
Since, scale on x-axis starts at 135, a kink is shown near the origin on x-axis to indicate that the graph is drawn to scale beginning at 135.
Plot the points (140, 4), (145, 12), (150, 32), (155, 46), (160, 53), (165, 59) and (170, 60) representing upper class limits and the respective cumulative frequencies.
Also plot the point representing lower limit of the first class i.e. 135 - 140.Join these points by a freehand drawing.

The required ogive is shown in figure above.
(i) Here, n (no. of students) = 60.
To find the median :
Let A be the point on y-axis representing frequency = = 30.
Through A draw a horizontal line to meet the ogive at P. Through P, draw a vertical line to meet the x-axis at M. The abscissa of the point M represents 149.5.
Hence, the median height = 149.5 cm.
(ii) To find lower quartile :
Let B be the point on y-axis representing frequency = = 15.
Through B, draw a horizontal line to meet the ogive at Q. Through Q, draw a vertical line to meet the x-axis at N. The abscissa of the point N represents 146.
Hence, lower quartile = 146 cm.
(iii) Let O be the point on x-axis representing height = 158 cm.
Through O, draw a vertical line to meet the ogive at R. Through R, draw a horizontal line to meet the y-axis at C. The ordinate of the point C represents 51.
No. of boys shorter than 158 cm = 51
So, no. of boys taller than 158 cm = Total boys - boys shorter than 158 cm = 60 - 51 = 9.
Hence, there are 9 tall boys in the class.
40 students enter for a game of a shot put competition. The distance thrown in metre is recorded below:
| Distance in m | Number of students |
|---|---|
| 12 - 13 | 3 |
| 13 - 14 | 9 |
| 14 - 15 | 12 |
| 15 - 16 | 9 |
| 16 - 17 | 4 |
| 17 - 18 | 2 |
| 18 - 19 | 1 |
Use a graph paper to draw an ogive for the above distribution.
Uses scale of 2 cm = 1 m on one axis and 2 cm = 5 students on other axis.
Hence, using your graph, find:
(i) the median
(ii) upper quartile
(iii) no. of students who cover a distance which is above m.
Answer
Cumulative frequency distribution table :
| Distance in m | Frequency | Cumulative frequency |
|---|---|---|
| 12 - 13 | 3 | 3 |
| 13 - 14 | 9 | 12 |
| 14 - 15 | 12 | 24 |
| 15 - 16 | 9 | 33 |
| 16 - 17 | 4 | 37 |
| 17 - 18 | 2 | 39 |
| 18 - 19 | 1 | 40 |
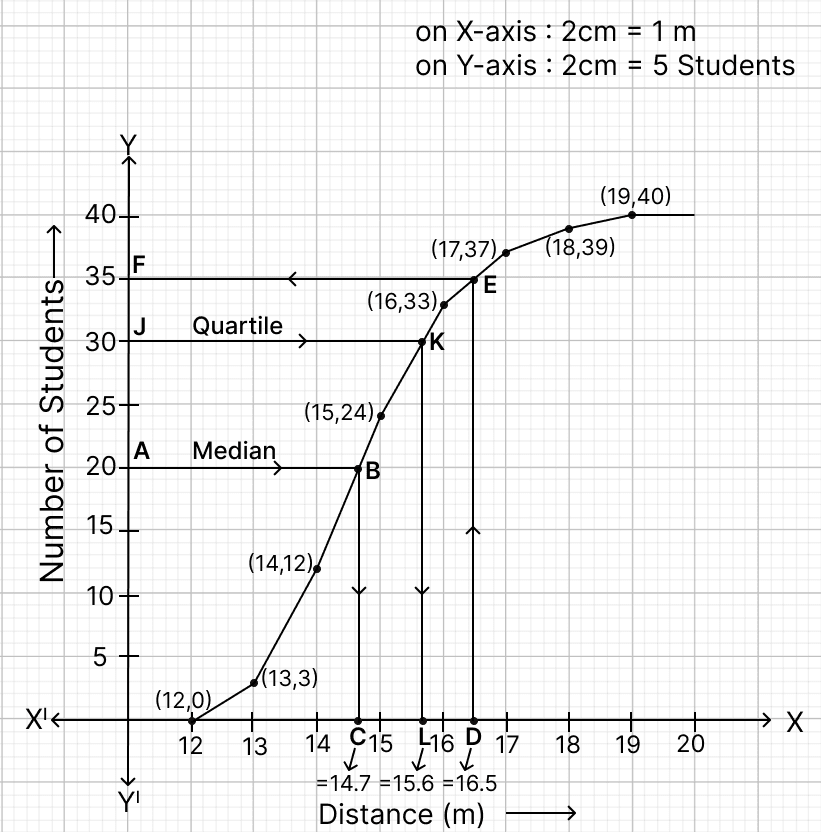
Steps of construction :
Since, the scale on x-axis starts at 12, a break (kink) is shown near the origin on x-axis to indicate that the graph is drawn to scale beginning at 12.
Take 2 cm along x-axis = 1 m.
Take 2 cm along y-axis = 5 students.
Plot the point (12, 0) as ogive starts from x-axis representing lower limit of first class.
Plot the points (13, 3), (14, 12), (15, 24), (16, 33), (17, 37), (18, 39) and (19, 40).
Join the points by a free hand curve.
(i) The total number of students is N = 40. The median position is found at .
Draw a line parallel to x-axis from point A (number of students) = 20, touching the graph at point B. From point B draw a line parallel to y-axis touching x-axis at point C.
From graph, C = 14.7
The median = 14.7 m.
(ii) Here, n = 40, which is even.
By formula,
Upper quartile = = 30.
Draw a line parallel to x-axis from point J (number of students) = 30, touching the graph at point K. From point K draw a line parallel to y-axis touching x-axis at point L.
From graph, L = 15.6
The upper quartile = 15.6 m
(iii) Draw a line parallel to y-axis from point D (Distance) = m = 16.5 m, touching the graph at point E. From point E draw a line parallel to x-axis touching y-axis at point F.
From graph, F = 35.
It means that 35 students who cover a distance either less or equal to m.
Number of student who cover a distance which is above m = 40 - 35 = 5.
Number of students who cover a distance above m = 5.
The marks obtained by 100 students in a Mathematics test are given below :
| Marks | No. of students |
|---|---|
| 0 - 10 | 3 |
| 10 - 20 | 7 |
| 20 - 30 | 12 |
| 30 - 40 | 17 |
| 40 - 50 | 23 |
| 50 - 60 | 14 |
| 60 - 70 | 9 |
| 70 - 80 | 6 |
| 80 - 90 | 5 |
| 90 - 100 | 4 |
Draw an ogive on a graph sheet and from it determine the :
(i) median
(ii) lower quartile
(iii) number of students who obtained more than 85% marks in the test
(iv) number of students who did not pass in the test if the pass percentage was 35.
Answer
- The cumulative frequency table for the given continuous distribution is :
| Marks | No. of students | Cumulative frequency |
|---|---|---|
| 0 - 10 | 3 | 3 |
| 10 - 20 | 7 | 10 |
| 20 - 30 | 12 | 22 |
| 30 - 40 | 17 | 39 |
| 40 - 50 | 23 | 62 |
| 50 - 60 | 14 | 76 |
| 60 - 70 | 9 | 85 |
| 70 - 80 | 6 | 91 |
| 80 - 90 | 5 | 96 |
| 90 - 100 | 4 | 100 |
Take 1 cm along x-axis = 10 (marks)
Take 1 cm along y-axis = 10 (students)
Plot the points (10, 3), (20, 10), (30, 22), (40, 39), (50, 62), (60, 76), (70, 85), (80, 91), (90, 96) and (100, 100) representing upper class limits and the respective cumulative frequencies. Also plot the point representing lower limit of the first class i.e. 0 - 10.
Join these points by a freehand drawing.
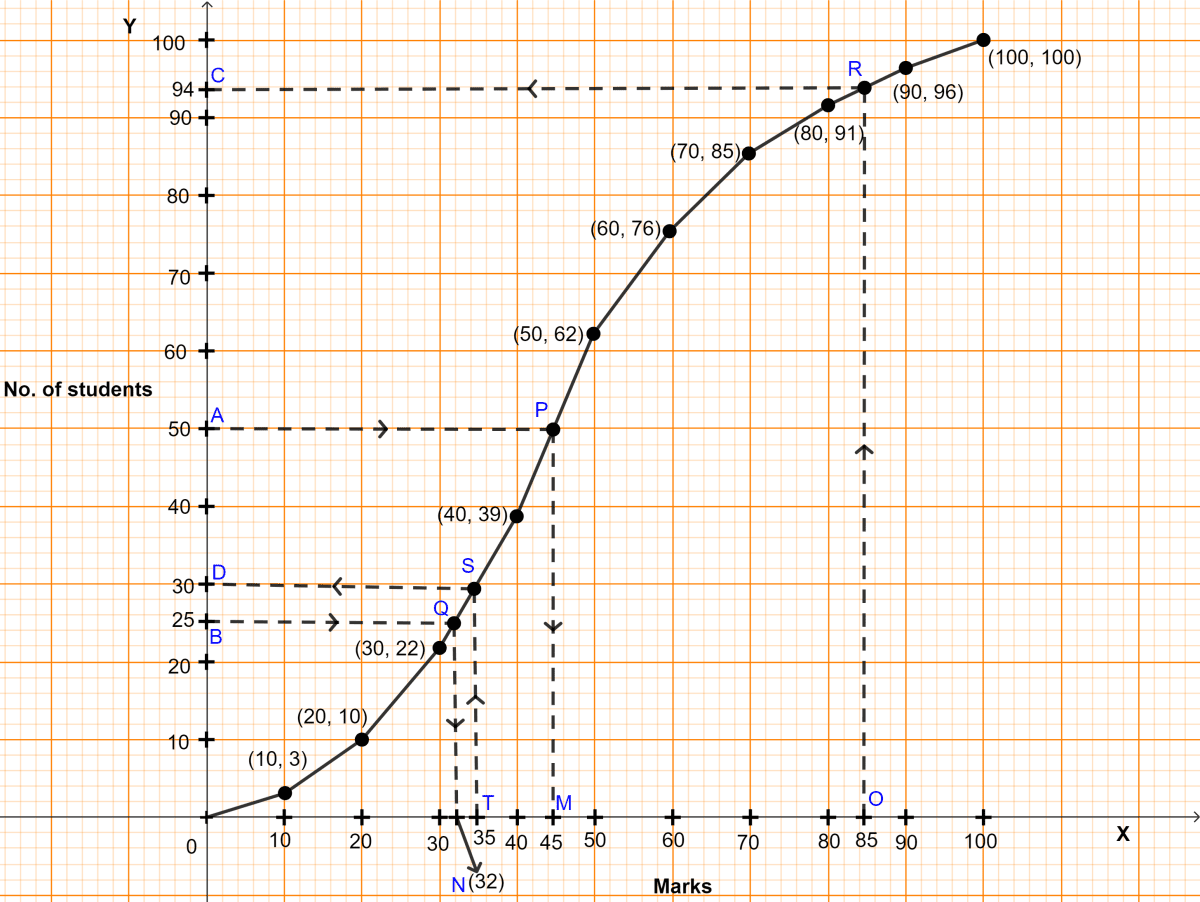
The required ogive is shown in figure above.
(i) Here, n (no. of students) = 100.
To find the median :
Let A be the point on y-axis representing frequency = = 50.
Through A draw a horizontal line to meet the ogive at P. Through P, draw a vertical line to meet the x-axis at M. The abscissa of the point M represents 45
Hence, the median marks = 45.
(ii) To find lower quartile :
Let B be the point on y-axis representing frequency = = 25.
Through B, draw a horizontal line to meet the ogive at Q. Through Q, draw a vertical line to meet the x-axis at N. The abscissa of the point N represents 32.
Hence, lower quartile = 32.
(iii) Total marks = 100.
85% marks = 85 numbers.
Let O be the point on x-axis representing marks = 85.
Through O draw a vertical line to meet the ogive at R. Through R, draw a horizontal line to meet the y-axis at C. The ordinate of the point C represents 94.
Hence, 94 students score less than 85 so students scoring more than 85 = 100 - 94 = 6.
Hence, 6 students score more than 85% in the test.
(iv) 35% of 100 = 35.
Let T be the point on x-axis representing marks = 35.
Through T, draw a vertical line to meet the ogive at S. Through S, draw a horizontal line to meet the y-axis at D. The ordinate of the point D represents 30.
No. of students who scored less than 35 marks = 30.
Hence, 30 students were failed in the examination.
The marks obtained by 120 students in a Mathematics test are given below:
| Marks | No. of students |
|---|---|
| 0 - 10 | 5 |
| 10 - 20 | 9 |
| 20 - 30 | 16 |
| 30 - 40 | 22 |
| 40 - 50 | 26 |
| 50 - 60 | 18 |
| 60 - 70 | 11 |
| 70 - 80 | 6 |
| 80 - 90 | 4 |
| 90 - 100 | 3 |
Draw an ogive for the given distribution on a graph sheet. Use a suitable scale for ogive to estimate the following :
(i) the median
(ii) the number of students who obtained more than 75% marks in the test.
(iii) the number of students who did not pass in the test if the pass percentage was 40.
Answer
- The cumulative frequency table for the given continuous distribution is :
| Marks | No. of students | Cumulative frequency |
|---|---|---|
| 0 - 10 | 5 | 5 |
| 10 - 20 | 9 | 14 |
| 20 - 30 | 16 | 30 |
| 30 - 40 | 22 | 52 |
| 40 - 50 | 26 | 78 |
| 50 - 60 | 18 | 96 |
| 60 - 70 | 11 | 107 |
| 70 - 80 | 6 | 113 |
| 80 - 90 | 4 | 117 |
| 90 - 100 | 3 | 120 |
Take 1 cm along x-axis = 10 marks
Take 1 cm along y-axis = 10 students
Plot the points (10, 5), (20, 14), (30, 30), (40, 52), (50, 78), (60, 96), (70, 107), (80, 113), (90, 117) and (100, 120) representing upper class limits and the respective cumulative frequencies.
Also plot the point representing lower limit of the first class i.e. 0 - 10.Join these points by a freehand drawing.

The required ogive is shown in figure above.
(i) Here, n (no. of students) = 120.
To find the median :
Let A be the point on y-axis representing frequency = = 60.
Through A draw a horizontal line to meet the ogive at P. Through P, draw a vertical line to meet the x-axis at M. The abscissa of the point M represents marks = 43.5
Hence, the median marks = 43.5.
(ii) Total marks = 100.
75% marks = 75 numbers.
Let O be the point on x-axis representing marks = 75.
Through O draw a vertical line to meet the ogive at R. Through R, draw a horizontal line to meet the y-axis at C. The ordinate of the point C represents 110.
Hence, 110 students score less than 75 so students scoring more than 75 = 120 - 110 = 10.
Hence, 10 students score more than 75% in the test.
(iii) 40% of 100 = 40.
Let T be the point on x-axis representing marks = 40.
Through T, draw a vertical line to meet the ogive at S. Through S, draw a horizontal line to meet the y-axis at D. The ordinate of the point D represents 52.
No. of students who scored less than 40 marks = 52.
Hence, 52 students failed in the examination.
The following distribution represents the height of 160 students of a school.
| Height (in cm) | No. of students |
|---|---|
| 140 - 145 | 12 |
| 145 - 150 | 20 |
| 150 - 155 | 30 |
| 155 - 160 | 38 |
| 160 - 165 | 24 |
| 165 - 170 | 16 |
| 170 - 175 | 12 |
| 175 - 180 | 8 |
Draw an ogive for the given distribution taking 2 cm = 5 cm of height on one axis and 2 cm = 20 students on the other axis. Using the graph, determine :
(i) The median height.
(ii) The inter quartile range.
(iii) The number of students whose height is above 172 cm.
Answer
- The cumulative frequency table for the given continuous distribution is :
| Height (in cm) | No. of students | Cumulative frequency |
|---|---|---|
| 140 - 145 | 12 | 12 |
| 145 - 150 | 20 | 32 |
| 150 - 155 | 30 | 62 |
| 155 - 160 | 38 | 100 |
| 160 - 165 | 24 | 124 |
| 165 - 170 | 16 | 140 |
| 170 - 175 | 12 | 152 |
| 175 - 180 | 8 | 160 |
Take 2 cm along x-axis = 5 cm (height)
Take 1 cm along y-axis = 20 (students)
Since, scale on x-axis starts at 140, a kink is shown near the origin on x-axis to indicate that the graph is drawn to scale beginning at 140.
Plot the points (145, 12), (150, 32), (155, 62), (160, 100), (165, 124), (170, 140), (175, 152) and (180, 160) representing upper class limits and the respective cumulative frequencies. Also plot the point representing lower limit of the first class i.e. 140 - 145.
Join these points by a freehand drawing.

The required ogive is shown in figure above.
(i) Here, n (no. of students) = 160.
To find the median :
Let A be the point on y-axis representing frequency = = 80.
Through A draw a horizontal line to meet the ogive at P. Through P, draw a vertical line to meet the x-axis at M. The abscissa of the point M represents height = 157.5 cm.
Hence, the median height = 157.5 cm.
(ii) To find lower quartile :
Let B be the point on y-axis representing frequency = = 40
Through B, draw a horizontal line to meet the ogive at Q. Through Q, draw a vertical line to meet the x-axis at N. The abscissa of the point N represents 151.5.
To find upper quartile :
Let C be the point on y-axis representing frequency = = 120
Through C, draw a horizontal line to meet the ogive at R. Through R, draw a vertical line to meet the x-axis at O. The abscissa of the point O represents 164.
Inter quartile range = Upper quartile - Lower quartile = 164 - 151.5 = 12.5.
Hence, the inter quartile range = 12.5 cm.
(iii) Let T be the point on x-axis representing height = 172 cm.
Through T, draw a vertical line to meet the ogive at S. Through S, draw a horizontal line to meet the y-axis at D. The ordinate of the point D represents 144.
No. of students shorter than 172 cm = 144.
So, no. of students taller than 172 cm = Total students - No. of students shorter than 172 cm = 160 - 144 = 16.
Hence, there are 16 students taller than 172 cm.
Study the graph and answer each of the following :
(a) Name the curve plotted
(b) Total number of students
(c) The median marks
(d) Number of students scoring between 50 and 80 marks.

Answer
(a) From graph,
The curve plotted is a cumulative frequency curve (ogive).
(b) From graph,
The total number of students = 40.
(c) From graph,
The median marks = 56.
(d) From graph,
No of students scoring below 80 = 37
No of students scoring below 50 = 12
∴ No. of students scoring between 50 and 80 = 37 - 12 = 25.
Hence, the no. of students scoring between 50 and 80 = 25.