
The mean of 20 numbers is 18. If 3 is added to each of the first ten numbers, find the mean of new set of 20 numbers.
Answer
Mean =
∴ Sum of observations = Mean × No. of observations
⇒ Sum of observations = 18 × 20 = 360.
Since 3 is added to first ten numbers then total sum increases by 10 × 3 = 30.
New sum = 360 + 30 = 390.
Mean = = 19.5
Hence, the mean of new set of 20 numbers is 19.5
The average height of 30 students is 150 cm. It was detected later that one value of 165 cm was wrongly copied as 135 cm for the computation of mean. Find the correct mean.
Answer
Mean =
∴ Sum of observations = Mean × No. of observations
⇒ Sum of observations = 150 × 30 = 4500.
Since, one value of 165 cm was wrongly copied as 135 cm,
∴ Correct sum of observations = 4500 - 135 + 165 = 4530.
Correct mean = = 151.
Hence, the correct mean is 151 cm.
There are 50 students in a class of which 40 are boys and the rest girls. The average weight of the students in the class is 44 kg and the average weight of the girls is 40 kg. Find the average weight of boys.
Answer
No. of girls = Total - No. of boys = 50 - 40 = 10.
Average weight of class =
∴ Total weight = Average weight × No. of students
⇒ Total weight = 44 × 50 = 2200
Average weight of girls =
∴ Weight of girls = Average weight of girls × No. of girls
⇒ Weight of girls = 40 × 10 = 400.
Total weight of boys = Total weight - Weight of girls = 2200 - 400 = 1800.
Average weight of boys = = 45.
Hence, the average weight of boys is 45 kg.
The heights of 50 children were measured (correct to the nearest cm) giving the following results :
| Height (in cm) | No. of children |
|---|---|
| 65 | 1 |
| 66 | 4 |
| 67 | 5 |
| 68 | 7 |
| 69 | 11 |
| 70 | 10 |
| 71 | 6 |
| 72 | 4 |
| 73 | 2 |
Calculate the mean height for this distribution correct to one place of decimal.
Answer
We construct the table as under :
| Height (xi) | No. of children (fi) | fixi |
|---|---|---|
| 65 | 1 | 65 |
| 66 | 4 | 264 |
| 67 | 5 | 335 |
| 68 | 7 | 476 |
| 69 | 11 | 759 |
| 70 | 10 | 700 |
| 71 | 6 | 426 |
| 72 | 4 | 288 |
| 73 | 2 | 146 |
| Total | 50 | 3459 |
Mean = = 69.2 cm.
Hence, mean height = 69.2 cm.
Find the value of p, if the mean of the following distribution is 18.
| Variate (x) | Frequency (f) |
|---|---|
| 13 | 8 |
| 15 | 2 |
| 17 | 3 |
| 19 | 4 |
| 20 + p | 5p |
| 23 | 6 |
Answer
We construct the table as under :
| Variate (x) | Frequency (f) | fx |
|---|---|---|
| 13 | 8 | 104 |
| 15 | 2 | 30 |
| 17 | 3 | 51 |
| 19 | 4 | 76 |
| 20 + p | 5p | 5p2 + 100p |
| 23 | 6 | 138 |
| Total | 5p + 23 | 5p2 + 100p + 399 |
⇒ 5p - 5 = 0 or p + 3 = 0
⇒ 5p = 5 or p = -3
⇒ p = 1 or p = -3.
Since, frequency cannot be negative so p = 1.
Hence, the value of p = 1.
Find the mean age in years from the frequency distribution given below :
| Age in years | No. of persons |
|---|---|
| 25 - 29 | 4 |
| 30 - 34 | 14 |
| 35 - 39 | 22 |
| 40 - 44 | 16 |
| 45 - 49 | 6 |
| 50 - 54 | 5 |
| 55 - 59 | 3 |
Answer
The above data is discontinuous converting in continuous data we get,
Adjustment factor = (Lower limt of one class - Upper limit of previous class) / 2
| Classes before adjustment | Classes after adjustment | Class mark (ui) | No. of persons (fi) | fiui |
|---|---|---|---|---|
| 25 - 29 | 24.5 - 29.5 | 27 | 4 | 108 |
| 30 - 34 | 29.5 - 34.5 | 32 | 14 | 448 |
| 35 - 39 | 34.5 - 39.5 | 37 | 22 | 814 |
| 40 - 44 | 39.5 - 44.5 | 42 | 16 | 672 |
| 45 - 49 | 44.5 - 49.5 | 47 | 6 | 282 |
| 50 - 54 | 49.5 - 54.5 | 52 | 5 | 260 |
| 55 - 59 | 54.5 - 59.5 | 57 | 3 | 171 |
| Total | 70 | 2755 |
Mean = = 39.36 years
Hence, the mean age = 39.36 years.
The mean of the following frequency distribution is 62.8. Find the value of p :
| Classes | Frequency |
|---|---|
| 0 - 20 | 5 |
| 20 - 40 | 8 |
| 40 - 60 | p |
| 60 - 80 | 12 |
| 80 - 100 | 7 |
| 100 - 120 | 8 |
Answer
We construct the following table :
| Classes | Class mark (ui) | Frequency (fi) | fiui |
|---|---|---|---|
| 0 - 20 | 10 | 5 | 50 |
| 20 - 40 | 30 | 8 | 240 |
| 40 - 60 | 50 | p | 50p |
| 60 - 80 | 70 | 12 | 840 |
| 80 - 100 | 90 | 7 | 630 |
| 100 - 120 | 110 | 8 | 880 |
| Total | 40 + p | 2640 + 50p |
Hence, the value of p = 10.
The daily expenditure on milk and vegetables of 100 families are given below. Calculate f1 and f2, if the mean daily expenditure is ₹188.
| Expenditure (in ₹) | No. of families |
|---|---|
| 140 - 160 | 5 |
| 160 - 180 | 25 |
| 180 - 200 | f1 |
| 200 - 220 | f2 |
| 220 - 240 | 5 |
Answer
We construct the table as under :
| Expenditure (in ₹) | Class mark (ui) | No. of families (fi) | fiui |
|---|---|---|---|
| 140 - 160 | 150 | 5 | 750 |
| 160 - 180 | 170 | 25 | 4250 |
| 180 - 200 | 190 | f1 | 190f1 |
| 200 - 220 | 210 | f2 | 210f2 |
| 220 - 240 | 230 | 5 | 1150 |
| Total | 35 + f1 + f2 | 6150 + 190f1 + 210f2 |
As there are 100 families,
∴ 35 + f1 + f2 = 100
⇒ f1 + f2 = 100 - 35 = 65
⇒ f1 = 65 - f2 ......(i)
Using (i),
⇒ f1 = 65 - f2 = 65 - 15 = 50.
Hence, f1 = 50 and f2 = 15.
The median of the following numbers, arranged in ascending order, is 25. Find x :
11, 13, 15, 19, x + 2, x + 4, 30, 35, 39, 46.
Answer
Here, n (no. of observations) = 10, which is even.
Given, median = 25.
∴ x + 3 = 25
⇒ x = 22.
Hence, the value of x = 22.
If the median of 5, 9, 11, 3, 4, x, 8 is 6, find the value of x.
Answer
Arranging the numbers in ascending order we get,
3, 4, 5, x, 8, 9, 11.
Here n (no. of observations) = 7
Given, median = 6.
∴ 6 = 4th observation = x.
Hence, the value of x = 6.
The marks scored by 16 students in a class test are :
3, 6, 8, 13, 15, 5, 21, 23, 17, 10, 9, 1, 20, 21, 18, 12.
Find :
(i) the median
(ii) lower quartile
(iii) upper quartile
(iv) inter quartile range.
Answer
On arranging the numbers in ascending order we get,
1, 3, 5, 6, 8, 9, 10, 12, 13, 15, 17, 18, 20, 21, 21, 23.
(i) Here, n (no. of observations) = 16, which is even.
Hence, the median of following data = 12.5.
(ii) Here, n (no. of observations) = 16, which is even.
Hence, lower quartile = 6.
(iii) Here, n (no. of observations) = 16, which is even.
Hence, upper quartile = 18.
(iv) Inter quartile range = Upper quartile - Lower quartile = 18 - 6 = 12.
Hence, inter quartile range = 12.
Calculate the mean, the median and the mode of the following distribution :
| Age in years | No. of students |
|---|---|
| 12 | 2 |
| 13 | 3 |
| 14 | 5 |
| 15 | 6 |
| 16 | 4 |
| 17 | 3 |
| 18 | 2 |
Answer
We construct the table as under :
| Age in years (xi) | No. of students (fi) | Cumulative frequency | fixi |
|---|---|---|---|
| 12 | 2 | 2 | 24 |
| 13 | 3 | 5 | 39 |
| 14 | 5 | 10 | 70 |
| 15 | 6 | 16 | 90 |
| 16 | 4 | 20 | 64 |
| 17 | 3 | 23 | 51 |
| 18 | 2 | 25 | 36 |
| Total | 25 | 374 |
Mean = = 14.96
Here, n (no. of observations) = 25, which is odd
The age of observation from 11th to 16th = 15.
∴ Median = 15.
Highest no. of students are 15 years old.
∴ Mode = 15.
Hence, mean = 14.96, median = 15 and mode = 15.
The daily canteen bill of 30 employees in an establishment is distributed as follows :
| Daily canteen bill (in ₹) | No. of employees |
|---|---|
| 0 - 10 | 1 |
| 10 - 20 | 8 |
| 20 - 30 | 10 |
| 30 - 40 | 5 |
| 40 - 50 | 4 |
| 50 - 60 | 2 |
Estimate the modal daily Canteen bill for this distribution by a graphical method.
Answer
Steps :
Take 2 cm along x-axis = 10 rupees and 1 cm along y-axis = 1 employee.
Construct rectangles corresponding to the given data.
In highest rectangle, draw two st. lines AC and BD from corners of the rectangles on either side of the highest rectangle to the opposite corners of the highest rectangle. Let P be the point of intersection of AC and BD.
Through P, draw a vertical line to meet the x-axis at M. The abscissa of the point M represents 23.

Hence, the required mode = ₹23.
Draw a cumulative frequency curve for the following data :
| Marks obtained | No. of students |
|---|---|
| 0 - 10 | 8 |
| 10 - 20 | 10 |
| 20 - 30 | 22 |
| 30 - 40 | 40 |
| 40 - 50 | 20 |
Hence, determine :
(i) the median
(ii) the pass marks if 85% of the students pass.
(iii) the marks which 45% of the students exceed.
Answer
- The cumulative frequency table for the given continuous distribution is :
| Marks obtained | No. of students | Cumulative frequency |
|---|---|---|
| 0 - 10 | 8 | 8 |
| 10 - 20 | 10 | 18 |
| 20 - 30 | 22 | 40 |
| 30 - 40 | 40 | 80 |
| 40 - 50 | 20 | 100 |
Take 2 cm along x-axis = 10 marks
Take 1 cm along y-axis = 10 (students)
Plot the points (10, 8), (20, 18), (30, 40), (40, 80) and (50, 100) representing upper class limits and the respective cumulative frequencies.
Also plot the point representing lower limit of the first class i.e. 0 - 10.Join these points by a freehand drawing.

The required ogive is shown in figure above.
(i) Here, n (no. of students) = 100.
To find the median :
Let A be the point on y-axis representing frequency = = 50.
Through A draw a horizontal line to meet the ogive at P. Through P, draw a vertical line to meet the x-axis at M. The abscissa of the point M represents 32.5 marks.
(ii) Total no. of students = 100.
85% of students pass i.e. 85 students pass.
Remaining no. of students = 15.
Let B be the point on y-axis representing frequency 15.
Through B draw a horizontal line to meet the ogive at Q. Through Q, draw a vertical line to meet the x-axis at N. The abscissa of the point N represents 18 marks.
Hence, passing marks = 18 if 85% students pass.
(iii) Total no. of students = 100.
45% of students i.e. 45 students.
Remaining no. of students = 55.
Let C be the point on y-axis representing frequency 55.
Through C draw a horizontal line to meet the ogive at R. Through R, draw a vertical line to meet the x-axis at O. The abscissa of the point O represents 34 marks.
Hence, 45% of students exceed 34 marks.
The given graph with a histogram represents the number of plants of different heights grown in a school campus. Study the graph carefully and answer the following questions :
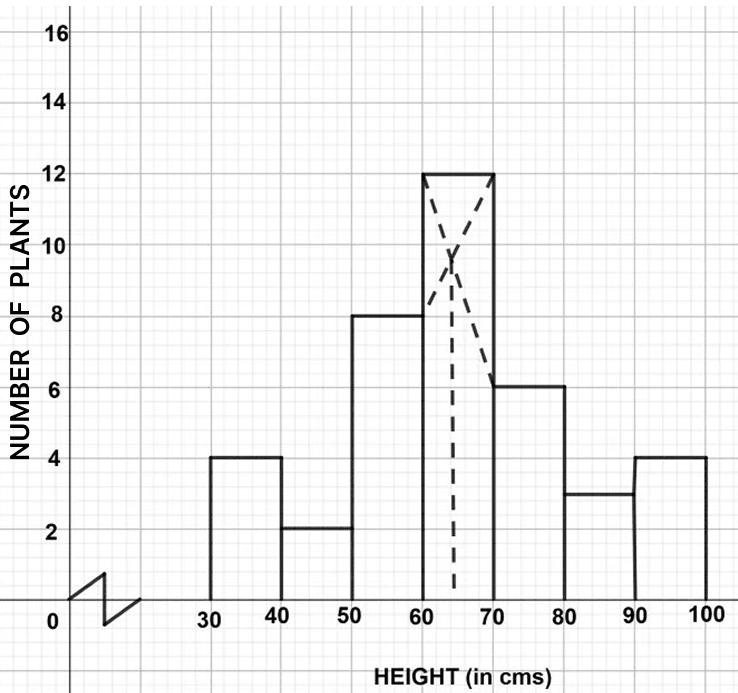
(a) Make a frequency table with respect to the class boundaries and their corresponding frequencies.
(b) State the modal class.
(c) Identify and note down the mode of the distribution.
(d) Find the number of plants whose height range is between 80 cm to 90 cm.
Answer
(a) Frequency table :
| Height (class) | Number of plants |
|---|---|
| 30-40 | 4 |
| 40-50 | 2 |
| 50-60 | 8 |
| 60-70 | 12 |
| 70-80 | 6 |
| 80-90 | 3 |
| 90-100 | 4 |
(b) From graph,
The modal class is 60-70.
(c) From graph,
The mode = 64.
(d) From graph,
The number of plants whose height range is between 80 cm to 90 cm are 3.