
Draw a histogram for the following frequency distribution and find the mode from the graph :
| Class | Frequency |
|---|---|
| 0 - 5 | 2 |
| 5 - 10 | 5 |
| 10 - 15 | 18 |
| 15 - 20 | 14 |
| 20 - 25 | 8 |
| 25 - 30 | 5 |
Answer
Steps :
- Take 1 cm along x-axis = 5 units and 1 cm along y-axis = 4 units.
- Construct rectangles corresponding to the given data.
- In highest rectangle, draw two st. lines AC and BD from corners of the rectangles on either side of the highest rectangle to the opposite corners of the highest rectangle. Let P be the point of intersection of AC and BD.
- Through P, draw a vertical line to meet the x-axis at M. The abscissa of the point M represents 14.

Hence, the required mode = 14.
A mathematics aptitude test of 50 students was recorded as follows :
| Marks | No. of students |
|---|---|
| 50 - 60 | 4 |
| 60 - 70 | 8 |
| 70 - 80 | 14 |
| 80 - 90 | 19 |
| 90 - 100 | 5 |
Draw a histogram for the above data using a graph paper and locate the mode.
Answer
Steps :
- Take 1 cm along x-axis = 10 marks and 1 cm along y-axis = 4 (students).
- Since, the scale on x-axis starts at 50, a break (zig-zag curve) is shown near the origin along x-axis to indicate that the graph is drawn to scale beginning at 50 and not at origin itself.
- Construct rectangles corresponding to the given data.
- In highest rectangle, draw two st. lines AC and BD from corners of the rectangles on either side of the highest rectangle to the opposite corners of the highest rectangle. Let P be the point of intersection of AC and BD.
- Through P, draw a vertical line to meet the x-axis at M. The abscissa of the point M represents 82.5.

Hence, the required mode = 82.5
Draw a histogram and estimate the mode for the following frequency distribution :
| Classes | Frequency |
|---|---|
| 0 - 10 | 2 |
| 10 - 20 | 8 |
| 20 - 30 | 10 |
| 30 - 40 | 5 |
| 40 - 50 | 4 |
| 50 - 60 | 3 |
Answer
Steps :
- Take 1 cm along x-axis = 10 units and 1 cm along y-axis = 2 units.
- Construct rectangles corresponding to the given data.
- In highest rectangle, draw two st. lines AC and BD from corners of the rectangles on either side of the highest rectangle to the opposite corners of the highest rectangle. Let P be the point of intersection of AC and BD.
- Through P, draw a vertical line to meet the x-axis at M. The abscissa of the point M represents 23.

Hence, the required mode = 23.
Using a graph paper, draw a histogram for the given distribution showing the number of runs scored by 50 batsmen. Estimate the mode of the data :
| Runs scored | No. of batsmen |
|---|---|
| 3000 - 4000 | 4 |
| 4000 - 5000 | 18 |
| 5000 - 6000 | 9 |
| 6000 - 7000 | 6 |
| 7000 - 8000 | 7 |
| 8000 - 9000 | 2 |
| 9000 - 10000 | 4 |
Answer
Steps :
- Take 1 cm along x-axis = 1000 runs and 1 cm along y-axis = 4 (batsman).
- Construct rectangles corresponding to the given data.
- In highest rectangle, draw two st. lines AC and BD from corners of the rectangles on either side of the highest rectangle to the opposite corners of the highest rectangle. Let P be the point of intersection of AC and BD.
- Through P, draw a vertical line to meet the x-axis at M. The abscissa of the point M represents 4600.

Hence, the required mode = 4600.
Draw a histogram for the given data, using a graph paper:
| Weekly Wages (in ₹) | No. of people |
|---|---|
| 3000 - 4000 | 4 |
| 4000 - 5000 | 9 |
| 5000 - 6000 | 18 |
| 6000 - 7000 | 6 |
| 7000 - 8000 | 7 |
| 8000 - 9000 | 2 |
| 9000 - 10000 | 4 |
Estimate the mode from the graph.
Answer
Steps :
Take 1 cm along x-axis = 1000 rupees and 1 cm along y-axis = 2 (No. of people).
Construct rectangles corresponding to the given data.
In highest rectangle, draw two st. lines AD and BC from corners of the rectangles on either side of the highest rectangle to the opposite corners of the highest rectangle. Let P be the point of intersection of AD and BC.
Through P, draw a vertical line to meet the x-axis at M. The abscissa of the point M represents 5400.
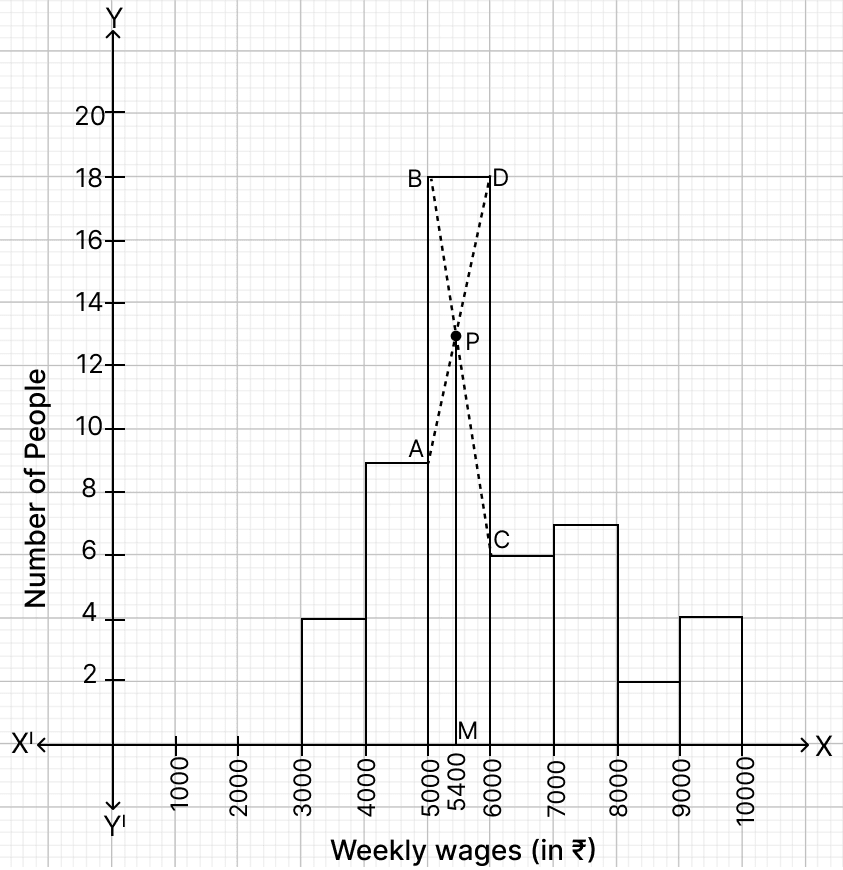
Hence, mode = ₹ 5,400.
Use a graph paper for this question. The daily pocket expenses of 200 students in a school are given below :
| Pocket expenses (in ₹) | No. of students (frequency) |
|---|---|
| 0 - 5 | 10 |
| 5 - 10 | 14 |
| 10 - 15 | 28 |
| 15 - 20 | 42 |
| 20 - 25 | 50 |
| 25 - 30 | 30 |
| 30 - 35 | 14 |
| 35 - 40 | 12 |
Draw a histogram representing the above distribution and estimate the mode from the graph.
Answer
Steps :
- Take 1 cm along x-axis = ₹5 and 1 cm along y-axis = 5 students.
- Construct rectangles corresponding to the given data.
- In highest rectangle, draw two st. lines AC and BD from corners of the rectangles on either side of the highest rectangle to the opposite corners of the highest rectangle. Let P be the point of intersection of AC and BD.
- Through P, draw a vertical line to meet the x-axis at M. The abscissa of the point M represents ₹21.50.

Hence, the required mode = ₹21.50.
Draw a histogram for the following distribution :
| Wt. (in kg) | No. of students |
|---|---|
| 40 - 44 | 2 |
| 45 - 49 | 8 |
| 50 - 54 | 12 |
| 55 - 59 | 10 |
| 60 - 64 | 6 |
| 65 - 69 | 4 |
Hence, estimate the modal weight.
Answer
Steps :
- The given frequency distribution is discontinuous, to convert it into continuous distribution,
Adjustment factor = = 0.5
We construct the continuous frequency table for the given data :
| Classes before adjustment | Classes after adjustment | No. of students |
|---|---|---|
| 40 - 44 | 39.5 - 44.5 | 2 |
| 45 - 49 | 44.5 - 49.5 | 8 |
| 50 - 54 | 49.5 - 54.5 | 12 |
| 55 - 59 | 54.5 - 59.5 | 10 |
| 60 - 64 | 59.5 - 64.5 | 6 |
| 65 - 69 | 64.5 - 69.5 | 4 |
Take 2 cm along x-axis = 5 kg and 1 cm along y-axis = 2 (students).
Since, the scale on x-axis starts at 39.5, a break (zig-zag curve) is shown near the origin along x-axis to indicate that the graph is drawn to scale beginning at 39.5 and not at origin itself.
Construct rectangles corresponding to the given data.
In highest rectangle, draw two st. lines AC and BD from corners of the rectangles on either side of the highest rectangle to the opposite corners of the highest rectangle. Let P be the point of intersection of AC and BD.
Through P, draw a vertical line to meet the x-axis at M. The abscissa of the point M represents 52.75 kg.
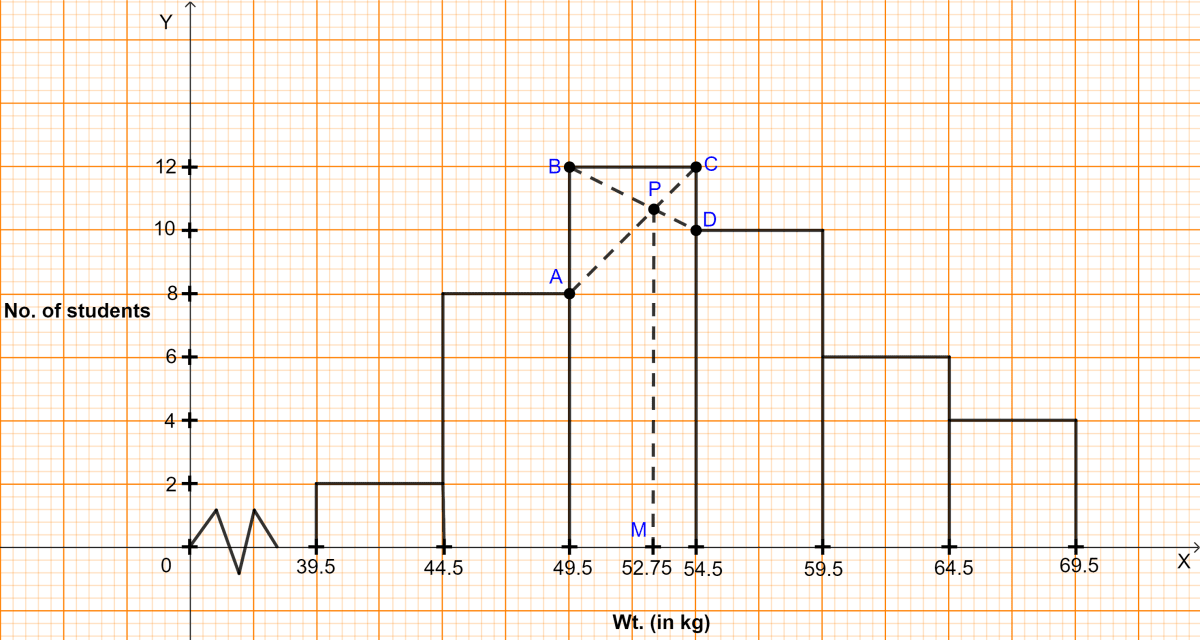
Hence, the required mode = 52.75 kg.
Find the mode of the following distribution by drawing a histogram.
| Mid value | Frequency |
|---|---|
| 12 | 20 |
| 18 | 12 |
| 24 | 8 |
| 30 | 24 |
| 36 | 16 |
| 42 | 8 |
| 48 | 12 |
Also state the modal class.
Answer
Size of each class = difference between two consecutive mid-values = 18 - 12 = 6.
Constructing the table as under :
| Mid value | Class | Frequency |
|---|---|---|
| 12 | 9 - 15 | 20 |
| 18 | 15 - 21 | 12 |
| 24 | 21 - 27 | 8 |
| 30 | 27 - 33 | 24 |
| 36 | 33 - 39 | 16 |
| 42 | 39 - 45 | 8 |
| 48 | 45 - 51 | 12 |
Steps :
Take 1 cm along x-axis = 6 units and 1 cm along y-axis = 4 units.
Since, the scale on x-axis starts at 9, a break (zig-zag curve) is shown near the origin along x-axis to indicate that the graph is drawn to scale beginning at 9 and not at origin itself.
Construct rectangles corresponding to the given data.
In highest rectangle, draw two st. lines AC and BD from corners of the rectangles on either side of the highest rectangle to the opposite corners of the highest rectangle. Let P be the point of intersection of AC and BD.
Through P, draw a vertical line to meet the x-axis at M. The abscissa of the point M represents 30.5.
∴ Mode = 30.5
As the class 27 - 33 has the highest frequency, hence modal class = 27 - 33.

Hence, the required mode = 30.5 and modal class = 27 - 33.
The table given below shows the runs scored by a cricket team during the overs of a match.
| Overs | Runs scored |
|---|---|
| 20-30 | 37 |
| 30-40 | 45 |
| 40-50 | 40 |
| 50-60 | 60 |
| 60-70 | 51 |
| 70-80 | 35 |
Use graph sheet for this question. Take 2 cm = 10 overs along one axis and 2 cm = 10 runs along the other axis.
(a) Draw a histogram representing the above distribution.
(b) Estimate the modal runs scored.
Answer
Steps :
Take 2 cm along x-axis = 10 overs and 1 cm along y-axis = 10 runs.
Since, the scale on x-axis starts at 20, a break (zig-zag curve) is shown near the origin along x-axis to indicate that the graph is drawn to scale beginning at 20 and not at origin itself.
Construct rectangles corresponding to the given data.
In highest rectangle, draw two st. lines KN and LI from corners of the rectangles on either side of the highest rectangle to the opposite corners of the highest rectangle. Let Z be the point of intersection of KN and LI.
Through Z, draw a vertical line to meet the x-axis at A. The abscissa of the point A represents 57.
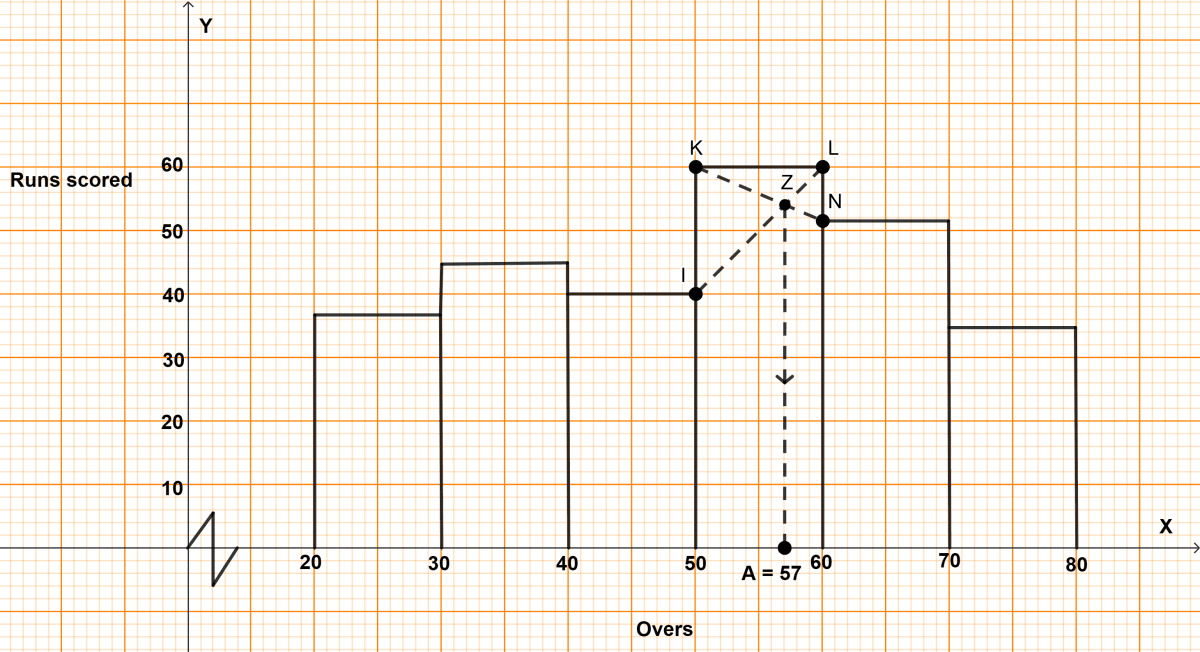
Hence, mode = 57.