
The data given below shows the marks of 12 students in a test, arranged in ascending order :
2, 3, 3, 3, 4, x, x + 2, 8, p, q, 8, 9.
If the given value of the median and mode is 6 and 8 respectively, then find the values of x, p, q.
Answer
By formula,
Median =
Substituting values we get :
Numbers :
2, 3, 3, 3, 4, 5, 7, 8, p, q, 8, 9.
Since, mode = 8, it means 8 occurs for the most times in the series.
Since, 3 occurs 3 times in the series,
∴ 8 must occur for atleast 4 times in order to be the mode.
∴ p = q = 8.
Hence, x = 5, p = 8 and q = 8.
The following data represents the daily wages in rupees of a certain number of employees of a company :
| Daily wages (in ₹) | No. of Employees |
|---|---|
| 30-40 | 8 |
| 40-50 | 14 |
| 50-60 | 12 |
| 60-70 | 17 |
| 70-80 | 20 |
| 80-90 | 26 |
| 90-100 | 13 |
| 100-110 | 10 |
Use a graph to answer the following questions :
(a) Represent the above distribution by an ogive.
(b) Find the following on the graph drawn:
(i) median wage.
(ii) percentage of employees who earn more than ₹ 84 per day.
(iii) number of employees who earn ₹56 and below.
Answer
Cumulative frequency distribution table :
| Daily wages (in ₹) | No. of employees | Cumulative frequency |
|---|---|---|
| 30-40 | 8 | 8 |
| 40-50 | 14 | 22 |
| 50-60 | 12 | 34 |
| 60-70 | 17 | 51 |
| 70-80 | 20 | 71 |
| 80-90 | 26 | 97 |
| 90-100 | 13 | 110 |
| 100-110 | 10 | 120 |
Here, n = 120, which is even.
Median = = 60th term.
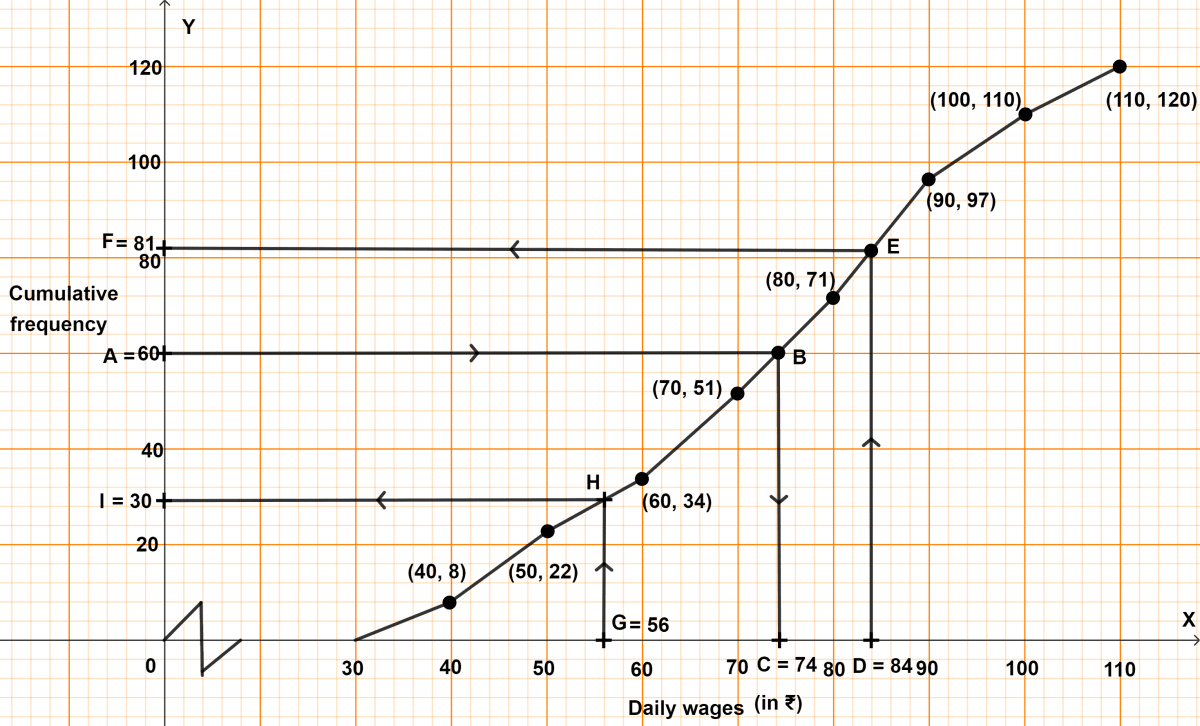
Steps of construction :
1. Plot daily wages on x-axis.
2. Plot cumulative frequency on y-axis.
3. Mark points (40, 8), (50, 22), (60, 34), (70, 51), (80, 71), (90, 97), (100, 110) and (110, 120).
4. Draw a free hand curve passing through the points marked, strating from the lower limit of first class and terminating at upper limit of the last class.
5. Mark A = 60 on y-axis, draw a horizontal line which meets curve at B.
6. Through point B, draw a vertical line which meets x-axis at point C. The value of point C on x-axis is the median. ∴ Median wage is ₹74.
7. Mark D = 84 on x-axis, draw a vertical line which meets curve at E.
8. Through point E, draw a horizontal line which meets y-axis at point F. The value of point F on y-axis represents no. of employees earning less than or equal to ₹ 84 per day.
From graph,
F = 81.
No. of employees earning more than ₹ 84 per day = 120 - 81 = 39.
Percentage of employees earning more than ₹ 84 =
= 32.5 %.
9. Mark G = 56 on x-axis, draw a vertical line which meets curve at H.
10. Through point H, draw a horizontal line which meets y-axis at point I. The value of point I on y-axis represents no. of employees earning less than or equal to ₹ 56 per day.
From graph,
I = 30.
No. of employees earning less than or equal to ₹ 56 per day = 30.
A life insurance agent found the following data of age distribution of 100 policy holders, where f is an unknown frequency.
| Age in years | No. of policy holders |
|---|---|
| 15-20 | 7 |
| 20-25 | 12 |
| 25-30 | 15 |
| 30-35 | 22 |
| 35-40 | f |
| 40-45 | 14 |
| 45-50 | 8 |
| 50-55 | 4 |
(a) If the mean age of the policy holders is 35.65 years, find the unknown frequency f.
(b) Find the median class of the distribution.
Answer
(a) Given,
Total no. of policy holders = 100
∴ 7 + 12 + 15 + 22 + f + 14 + 8 + 4 = 100
⇒ 82 + f = 100
⇒ f = 100 - 82 = 18.
Hence, f = 18.
(b) Cumulative frequency distribution table :
| Age in years | No. of policy holders | Cumulative frequency |
|---|---|---|
| 15-20 | 7 | 7 |
| 20-25 | 12 | 19 |
| 25-30 | 15 | 34 |
| 30-35 | 22 | 56 |
| 35-40 | 18 | 74 |
| 40-45 | 14 | 88 |
| 45-50 | 8 | 96 |
| 50-55 | 4 | 100 |
Since, n = 100, which is even.
Median = = 50th term.
Steps of construction :
Plot class interval on x-axis and cumulative frequency on y-axis.
Mark points (20, 7), (25, 19), (30, 34), (35, 56), (40, 74), (45, 88), (50, 96) and (55, 100).
Draw a free hand curve passing through the points marked and starting from the lower limit of first class and terminating at upper limit of the last class.
From point A = 50 draw a line parallel to x-axis touching the graph at point B. From point B draw a line parallel to y-axis touching x-axis at C.
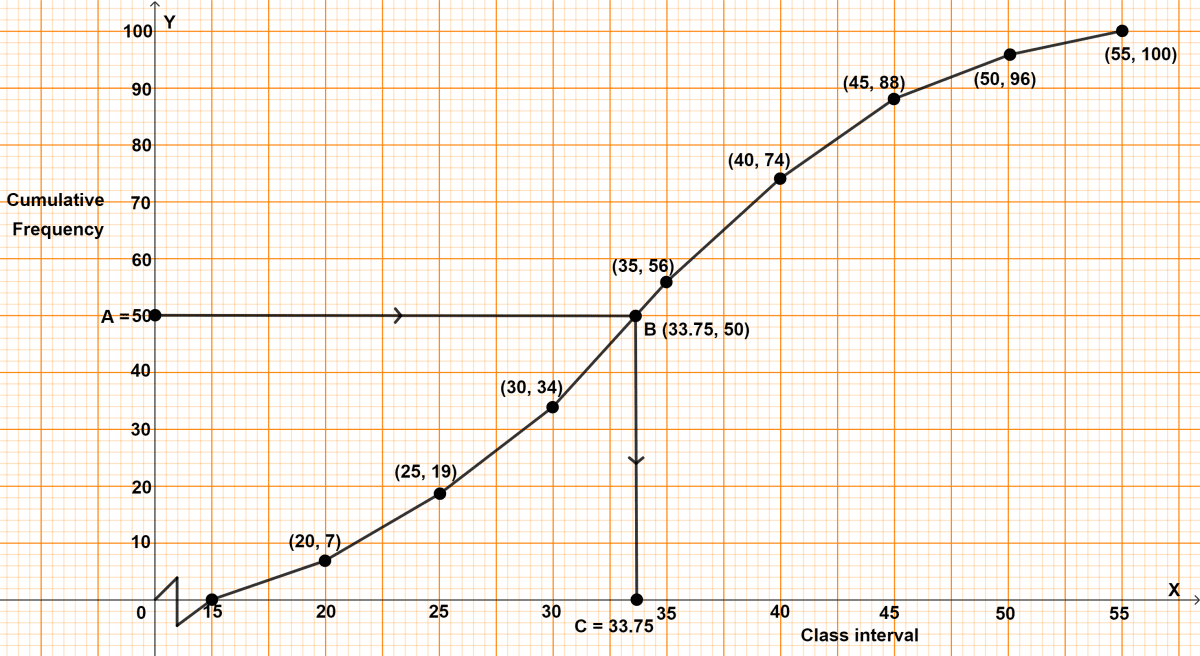
From graph,
C = 33.75, which lies between 30-35.
Hence, median class = 30-35.
The daily wages of workers in a construction unit were recorded as follows :
| Class marks (Wages) | No. of workers |
|---|---|
| 425 | 6 |
| 475 | 12 |
| 525 | 15 |
| 575 | 17 |
| 625 | 7 |
| 675 | 3 |
Form a frequency distribution table with class intervals and find modal wage by plotting a histogram.
Answer
Difference between two consecutive class marks = 475 - 425 = 50.
Adjustment factor = = 25.
Lower class limit = Class mark - Adjustment factor
Upper class limit = Class mark + Adjustment factor
| Class | Frequency |
|---|---|
| 400-450 | 6 |
| 450-500 | 12 |
| 500-550 | 15 |
| 550-600 | 17 |
| 600-650 | 7 |
| 650-700 | 3 |
Steps of construction :
Take 2 cm along x-axis = ₹50 and 2 cm along y-axis = 5 workers.
Construct rectangles corresponding to the given data.
In highest rectangle, draw two st. lines AD and BC from corners of the rectangles on either side of the highest rectangle to the opposite corners of the highest rectangle.
Let K be the point of intersection of AD and BC. Through K, draw a vertical line to meet the x-axis at L. The abscissa of the point L represents 557.50.
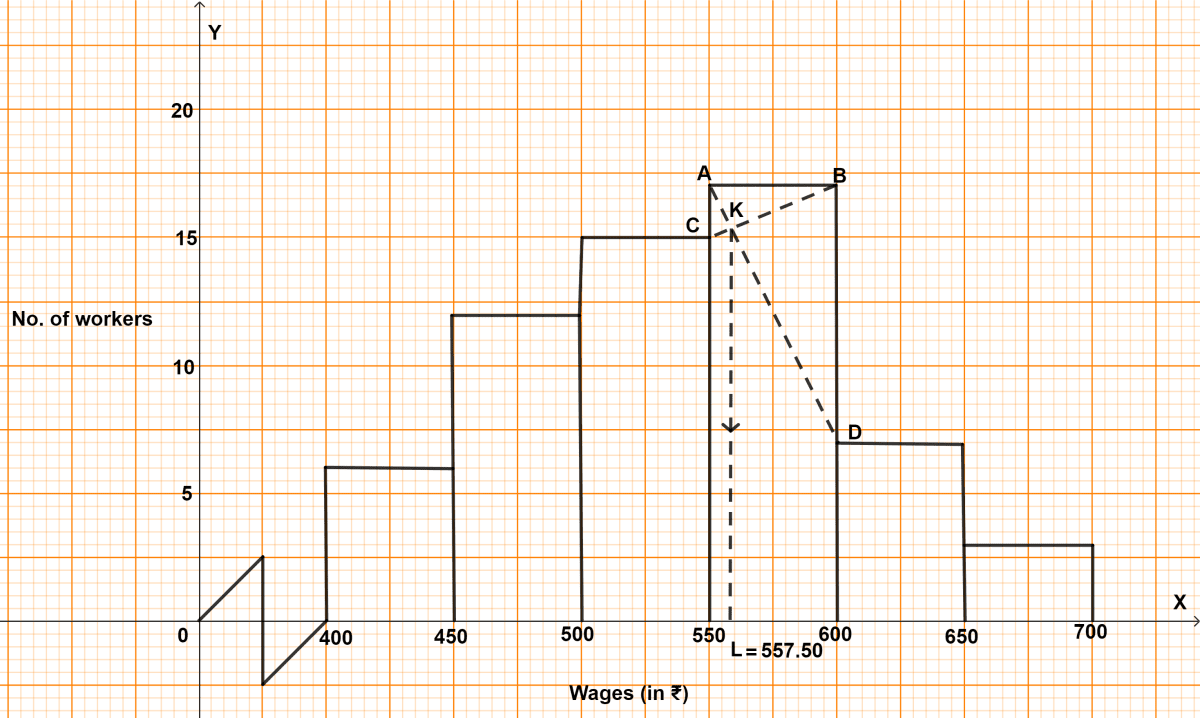
Hence, mode = ₹ 557.50
Study the graph and answer the questions that follow :
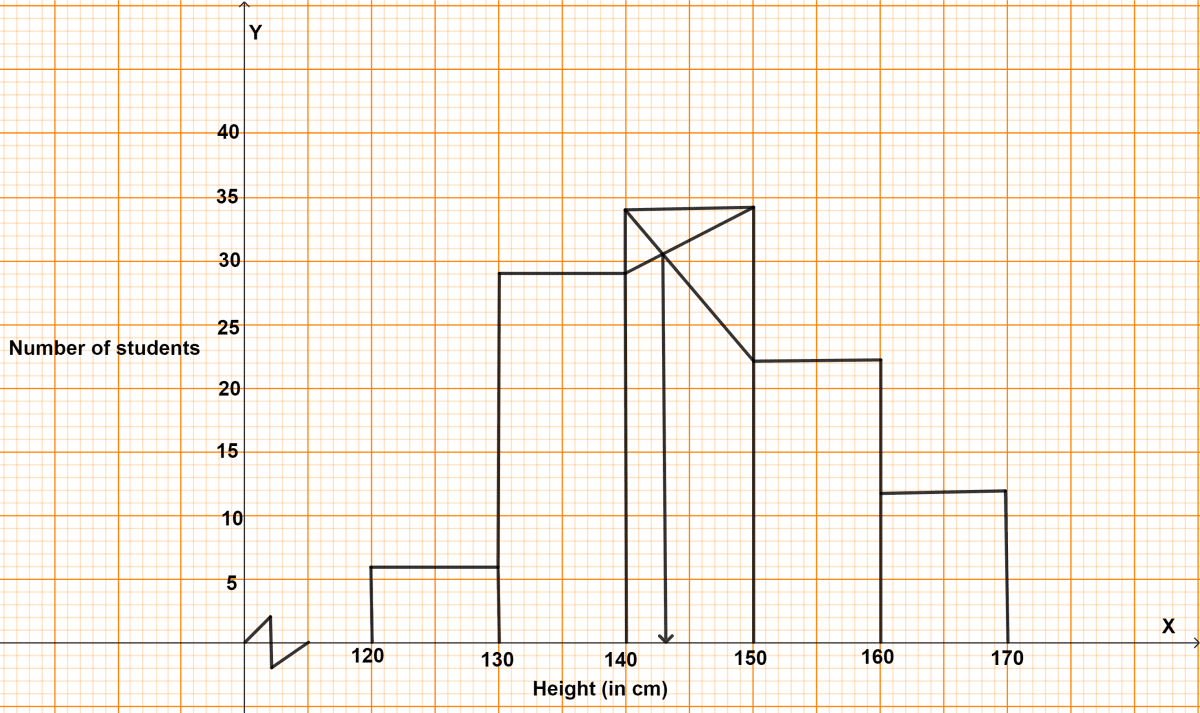
(a) Make a frequency table for the information provided in the graph.
(b) Find the number of students whose height is less than 150 cm.
(c) Find the total number of students.
(d) Find the modal height.
(e) Find the difference in the modal height and the mean height, if the average height of the students is 145.5 cm.
Answer
(a)
| Class | Frequency (f) | Cumulative frequency (c.f.) |
|---|---|---|
| 120-130 | 6 | 6 |
| 130-140 | 29 | 35 |
| 140-150 | 34 | 69 |
| 150-160 | 22 | 91 |
| 160-170 | 12 | 103 |
(b) From the above table,
The number of students whose height is less than 150 cm = 69.
(c) From the above table,
The total number of students = 103.
(d) From graph,
The modal height = 143 cm.
(e) Mean height = Average height = 145.5
Difference in the modal height and the mean height :
145.5 - 143 = 2.5 cm
Hence, difference between modal height and the mean height = 2.5 cm