
Calculate the mean, median and mode of the following numbers:
(i) 17, 19, 11, 23, 19
(ii) 7, 9, 8, 11, 8, 12, 8, 9
(iii) 2, 1, 0, 3, 1, 2, 3, 4, 3, 5
(iv) 8, 10, 7, 6, 10, 11, 6, 13, 10
Answer
(i) Arranging given observations in ascending order:
11, 17, 19, 19, 23
Sum of observations = 17 + 19 + 11 + 23 + 19 = 89.
By formula,
Mean = = 17.8
Here n = 5, which is odd.
By formula,
Median =
From set of observations, we see that:
19 has the maximum frequency.
Hence, mean = 17.8, median = 19, mode = 19.
(ii) Arranging given observations in ascending order:
7, 8, 8, 8, 9, 9, 11, 12
Sum of observations = 7 + 8 + 8 + 8 + 9 + 9 + 11 + 12 = 72
By formula,
Mean = = 9
Here n = 8, which is even.
By formula,
Median =
From set of observations, we see that :
8 has the maximum frequency.
Hence, mean = 9, median = 8.5, mode = 8.
(iii) Arranging given observations in ascending order:
0, 1, 1, 2, 2, 3, 3, 3, 4, 5
Sum of observations = 0 + 1 + 1 + 2 + 2 + 3 + 3 + 3 + 4 + 5 = 24
By formula,
Mean = = 2.4
Here n = 10, which is even.
By formula,
Median =
From set of observations, we see that:
3 has the maximum frequency.
Hence, mean = 2.4, median = 2.5, mode = 3.
(iv) Arranging given observations in ascending order:
6, 6, 7, 8, 10, 10, 10, 11, 13
Sum of observations = 6 + 6 + 7 + 8 + 10 + 10 + 10 + 11 + 13 = 81
By formula,
Mean = = 9
Here n = 9, which is odd.
By formula,
Median =
From set of observations, we see that:
10 has the maximum frequency.
Hence, mean = 9, median = 10, mode = 10.
The marks of 10 students of a class in an examination arranged in ascending order is as follows:
13, 35, 43, 46, x, x + 4, 55, 61, 71, 80
If the median marks is 48, find the value of x. Hence, find the mode of the given data.
Answer
Here, n = 10, which is even.
By formula,
Median =
Median =
⇒ 96 = 2x + 4
⇒ 2x = 96 - 4
⇒ 2x = 92
⇒ x =
⇒ x = 46
Set of observations : 13, 35, 43, 46, 46, 50, 55, 61, 71, 80
Here, 46 has the maximum frequency.
Hence, value of x = 46 and mode = 46.
The following sizes of shoes were sold by a shop on a particular day.
8, 9, 5, 6, 4, 9, 1, 9, 3, 6, 3, 9, 7, 1, 2, 9, 5
Find the modal size of the shoes sold.
Answer
In the given data : 8, 9, 5, 6, 4, 9, 1, 9, 3, 6, 3, 9, 7, 1, 2, 9, 5
9 is repeated more number of times than any other number.
Hence, modal size of the shoes sold = 9.
The following table shows the weights of 15 students :
| Weight (in kg) | Number of students |
|---|---|
| 47 | 4 |
| 50 | 3 |
| 53 | 2 |
| 56 | 2 |
| 60 | 4 |
Calculate :
(i) mean
(ii) median
(iii) mode
Answer
The variates are already in ascending order. We construct the cumulative frequency table as under:
| Weight(kg) (x) | No. of students (f) | Cumulative frequency | fx |
|---|---|---|---|
| 47 | 4 | 4 | 188 |
| 50 | 3 | 7 (4 + 3) | 150 |
| 53 | 2 | 9 (7 + 2) | 106 |
| 56 | 2 | 11 (9 + 2) | 112 |
| 60 | 4 | 15 (11 + 4) | 240 |
| Total | Σf = 15 | Σfx = 796 |
Total number of observations = 15, which is odd.
(i) By formula,
Hence, mean = 53.06.
(ii) By formula,
Median =
Cumulative frequencies 8th and 9th corresponds to 53 kg.
Hence, median = 53 kg.
(iii) The highest frequency is 4.
4 corresponds to two weight = 47 kg and 60 kg.
Hence, mode = 47 kg and 60 kg.
Calculate the mean, median and mode of the following distribution:
| Number | Frequency |
|---|---|
| 5 | 1 |
| 10 | 2 |
| 15 | 5 |
| 20 | 6 |
| 25 | 3 |
| 30 | 2 |
| 35 | 1 |
Answer
The variates are already in ascending order. We construct the cumulative frequency table as under:
| Number (x) | Frequency (f) | Cumulative frequency | fx |
|---|---|---|---|
| 5 | 1 | 1 | 5 |
| 10 | 2 | 3 (1 + 2) | 20 |
| 15 | 5 | 8 (3 + 5) | 75 |
| 20 | 6 | 14 (8 + 6) | 120 |
| 25 | 3 | 17 (14 + 3) | 75 |
| 30 | 2 | 19 (17 + 2) | 60 |
| 35 | 1 | 20 (19 + 1) | 35 |
| Total | Σf = 20 | Σfx = 390 |
Total number of observations = 20, which is even.
By formula,
By formula,
Median =
All observations from 9th to 14th are equal, each = 20
Then,
Median = = 20.
As the variate 20 has maximum frequency 6, so mode = 20.
Hence, mean = 19.5, median = 20, mode = 20.
In a class of 40 students, marks obtained by the students in a class test (out of 10) are given below :
| Marks | Number of students |
|---|---|
| 1 | 1 |
| 2 | 2 |
| 3 | 3 |
| 4 | 3 |
| 5 | 6 |
| 6 | 10 |
| 7 | 5 |
| 8 | 4 |
| 9 | 3 |
| 10 | 3 |
Calculate the following for the given distribution :
(i) Median
(ii) Mode
Answer
The variates are already in ascending order. We construct the cumulative frequency table as under:
| Marks | Number of students | Cumulative frequency |
|---|---|---|
| 1 | 1 | 1 |
| 2 | 2 | 3 (1 + 2) |
| 3 | 3 | 6 (3 + 3) |
| 4 | 3 | 9 (6 + 3) |
| 5 | 6 | 15 (9 + 6) |
| 6 | 10 | 25 (15 + 10) |
| 7 | 5 | 30 (25 + 5) |
| 8 | 4 | 34 (30 + 4) |
| 9 | 3 | 37 (34 + 3) |
| 10 | 3 | 40 (37 + 3) |
Total number of observations = 40, which is even.
(i) By formula,
Median =
All observations from 16th to 25th are equal, each = 6
Then,
Median = = 6.
Hence, median = 6.
(ii) As the variate 6 has maximum frequency 10, so mode = 6.
Hence, mode = 6.
The following table gives the daily wages of workers in a factory :
| Daily wages (in ₹) | Number of workers |
|---|---|
| 200 - 220 | 5 |
| 220 - 240 | 20 |
| 240 - 260 | 10 |
| 260 - 280 | 10 |
| 280 - 300 | 9 |
| 300 - 320 | 6 |
| 320 - 340 | 12 |
| 340 - 360 | 8 |
Find :
(i) the mean
(ii) the modal class
(iii) the number of workers getting daily wages below ₹ 300
(iv) the number of workers getting ₹ 260 or more but less than ₹ 340 as daily wages.
Answer
(i) We construct the following table :
| Daily wages (xi) | Number of workers (fi) | Class mark (ui) | Cumulative frequency | fiui |
|---|---|---|---|---|
| 200 - 220 | 5 | 210 | 5 | 1050 |
| 220 - 240 | 20 | 230 | 25 (20 + 5) | 4600 |
| 240 - 260 | 10 | 250 | 35 (25 + 10) | 2500 |
| 260 - 280 | 10 | 270 | 45 (35 + 10) | 2700 |
| 280 - 300 | 9 | 290 | 54 (45 + 9) | 2610 |
| 300 - 320 | 6 | 310 | 60 (54 + 6) | 1860 |
| 320 - 340 | 12 | 330 | 72 (60 + 12) | 3960 |
| 340 - 360 | 8 | 350 | 80 (72 + 8) | 2800 |
| Total | Σfi = 80 | Σfiui = 22080 |
By formula,
Hence, the mean is ₹ 276.
(ii) The class 220 - 240 has maximum frequency 20.
Hence, modal class = 220 - 240.
(iii) From table,
Hence, the number of workers getting daily wages below ₹ 300 = 54.
(iv) From table,
Hence, the number of workers getting ₹ 260 or more but less than ₹ 340 as daily wages = 72 - 35 = 37.
For the following frequency distribution, draw a histogram. Hence, calculate the mode.
| Marks | Frequency |
|---|---|
| 0 - 5 | 10 |
| 5 - 10 | 14 |
| 10 - 15 | 28 |
| 15 - 20 | 42 |
| 20 - 25 | 50 |
| 25 - 30 | 30 |
| 30 - 35 | 14 |
| 35 - 40 | 12 |
Answer
Steps :
Take 1 cm along x-axis = 5 marks and 1 cm along y-axis = 5 units (frequency).
Construct rectangles corresponding to the given data.
In highest rectangle, draw two st. lines AC and BD from corners of the rectangles on either side of the highest rectangle to the opposite corners of the highest rectangle. Let P be the point of intersection of AC and BD.
Through P, draw a vertical line to meet the x-axis at M. The abscissa of the point M represents 21.50
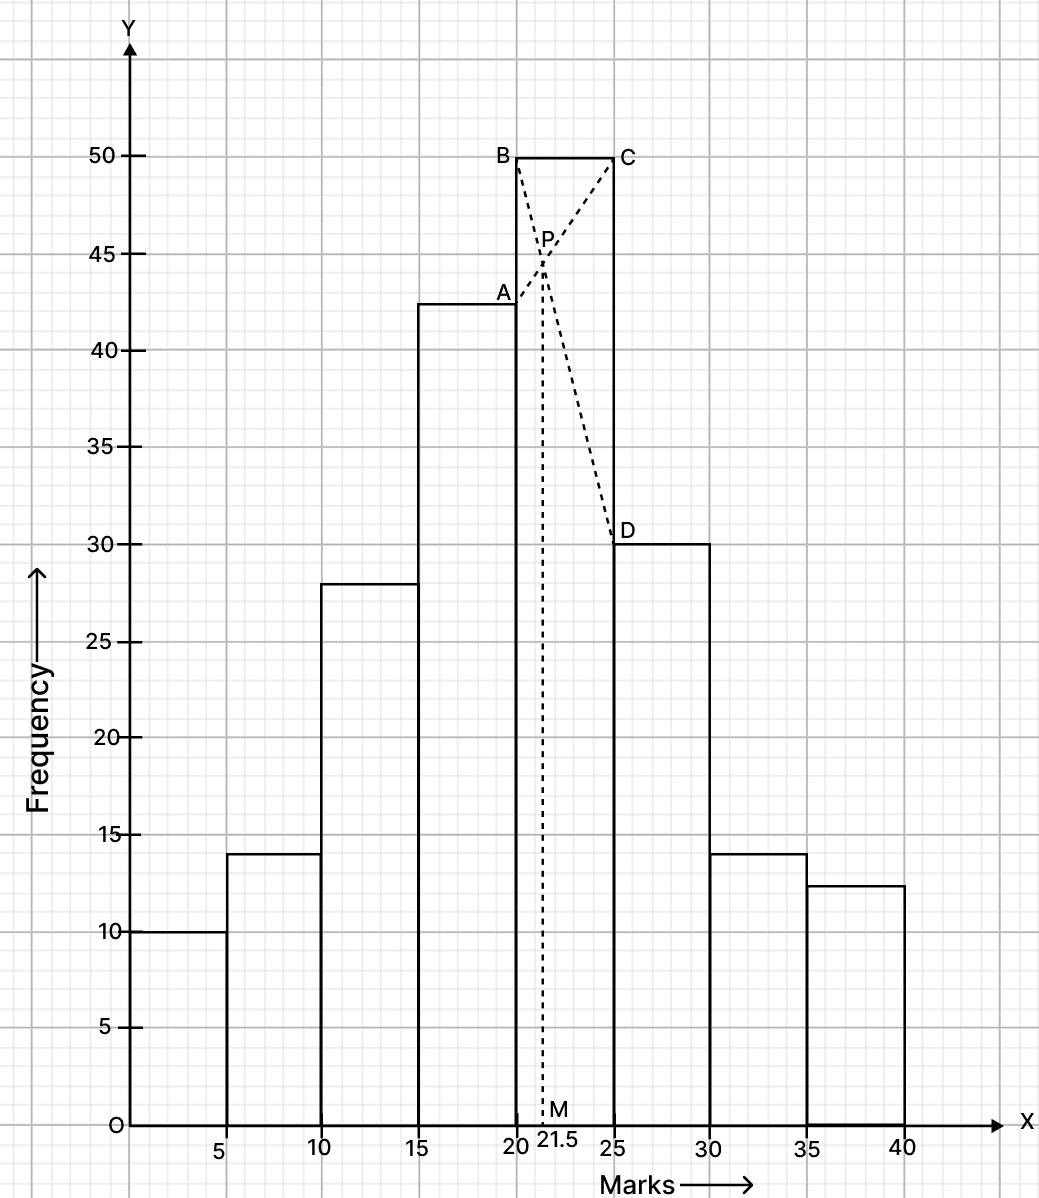
Hence, the required mode = 21.50.
Draw a histogram and hence estimate the mode for the following distribution.
| Class | Frequency |
|---|---|
| 0 - 5 | 2 |
| 5 - 10 | 5 |
| 10 - 15 | 18 |
| 15 - 20 | 14 |
| 20 - 25 | 8 |
| 25 - 30 | 5 |
Answer
Steps :
Take 1 cm along x-axis = 5 units and 1 cm along y-axis = 4 units.
Construct rectangles corresponding to the given data.
In highest rectangle, draw two st. lines AC and BD from corners of the rectangles on either side of the highest rectangle to the opposite corners of the highest rectangle. Let P be the point of intersection of AC and BD.
Through P, draw a vertical line to meet the x-axis at M. The abscissa of the point M represents 14.
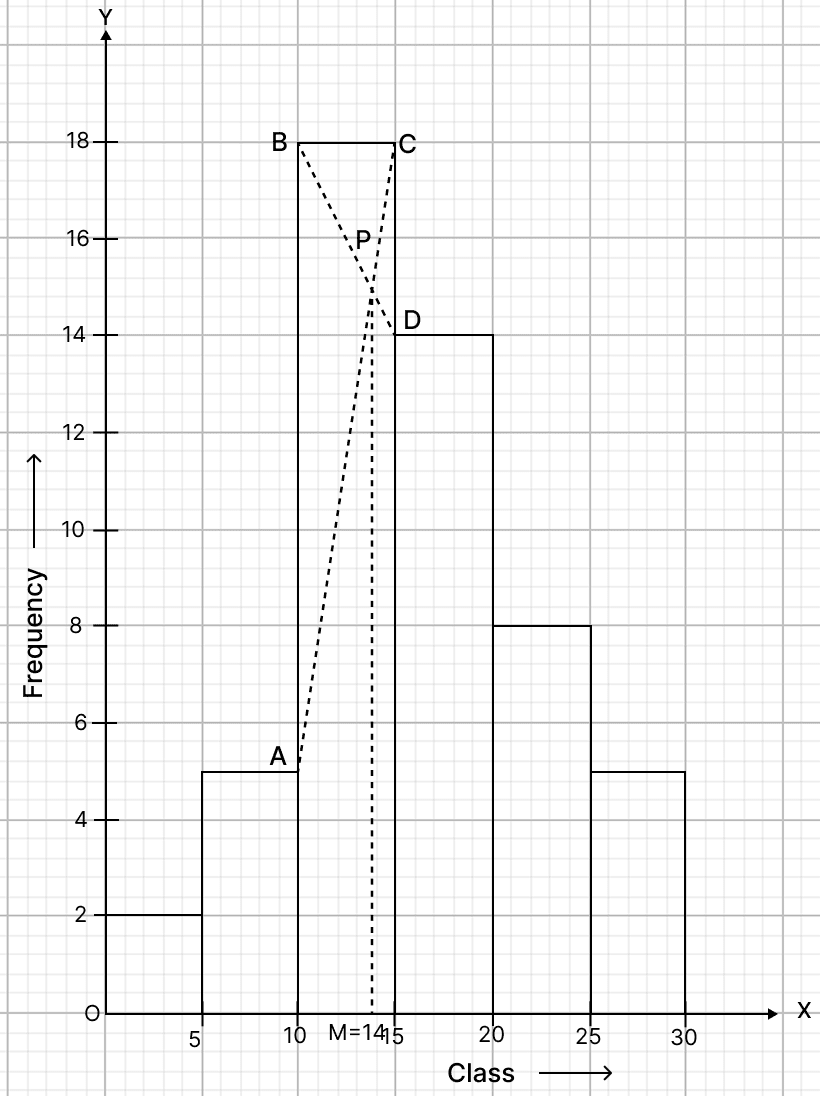
Hence, the required mode = 14.
The table given below shows the runs scored by a cricket team during the overs of a match.
| Overs | Runs scored |
|---|---|
| 20-30 | 37 |
| 30-40 | 45 |
| 40-50 | 40 |
| 50-60 | 60 |
| 60-70 | 51 |
| 70-80 | 35 |
(a) Draw a histogram representing the above distribution.
(b) Estimate the modal runs scored.
Answer
Steps :
Take 2 cm along x-axis = 10 overs and 1 cm along y-axis = 10 runs.
Since, the scale on x-axis starts at 20, a break (zig-zag curve) is shown near the origin along x-axis to indicate that the graph is drawn to scale beginning at 20 and not at origin itself.
Construct rectangles corresponding to the given data.
In highest rectangle, draw two st. lines KN and LI from corners of the rectangles on either side of the highest rectangle to the opposite corners of the highest rectangle. Let Z be the point of intersection of KN and LI.
Through Z, draw a vertical line to meet the x-axis at A. The abscissa of the point A represents 57.
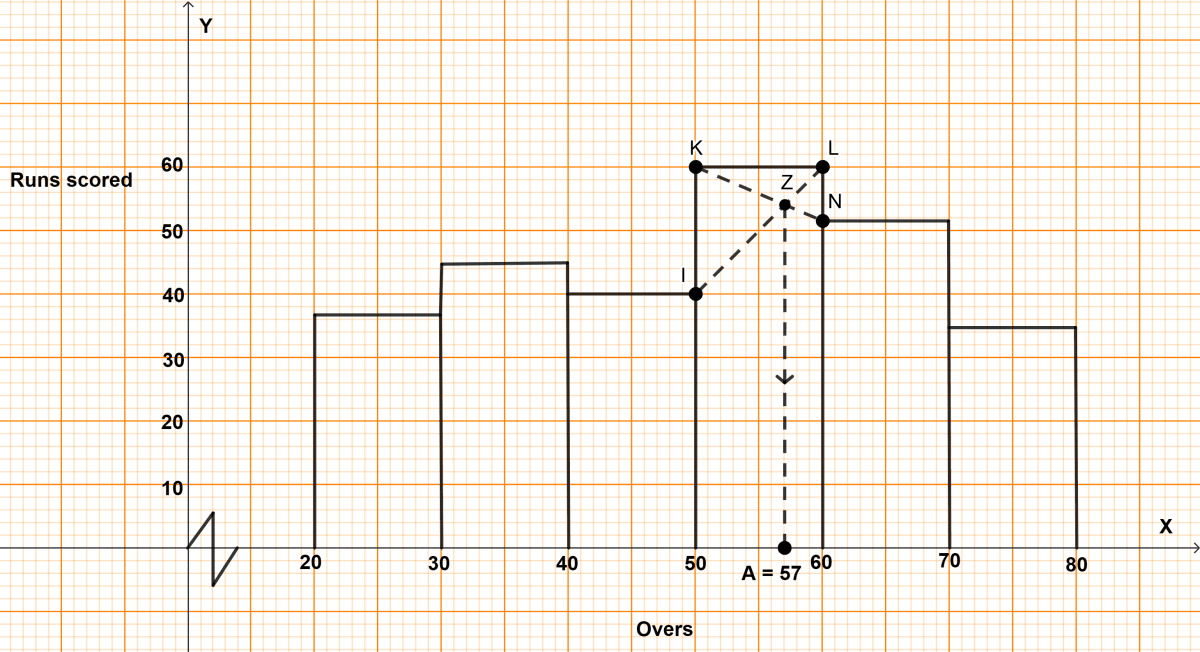
Hence, modal runs = 57.
For the following distribution, draw a histogram :
| Weight (in kg) | Frequency |
|---|---|
| 44 - 47 | 23 |
| 48 - 51 | 25 |
| 52 - 55 | 37 |
| 56 - 59 | 18 |
| 60 - 63 | 7 |
| 64 - 67 | 2 |
From the histogram, estimate the mode.
Answer
Steps :
- The given frequency distribution is discontinuous, to convert it into continuous distribution,
Adjustment factor = = 0.5
We construct the continuous frequency table for the given data :
| Classes before adjustment | Classes after adjustment | No. of students |
|---|---|---|
| 44 - 47 | 43.5 - 47.5 | 23 |
| 48 - 51 | 47.5 - 51.5 | 25 |
| 52 - 55 | 51.5 - 55.5 | 37 |
| 56 - 59 | 55.5 - 59.5 | 18 |
| 60 - 63 | 59.5 - 63.5 | 7 |
| 64 - 67 | 63.5 - 67.5 | 2 |
Take 2 cm along x-axis = 4 kg and 1 cm along y-axis = 4 (frequency).
Since, the scale on x-axis starts at 43.5, a break (zig-zag curve) is shown near the origin along x-axis to indicate that the graph is drawn to scale beginning at 43.5 and not at origin itself.
Construct rectangles corresponding to the given data.
In highest rectangle, draw two straight lines AC and BD from corners of the rectangles on either side of the highest rectangle to the opposite corners of the highest rectangle. Let P be the point of intersection of AC and BD.
Through P, draw a vertical line to meet the x-axis at M. The abscissa of the point M represents 53 kg.
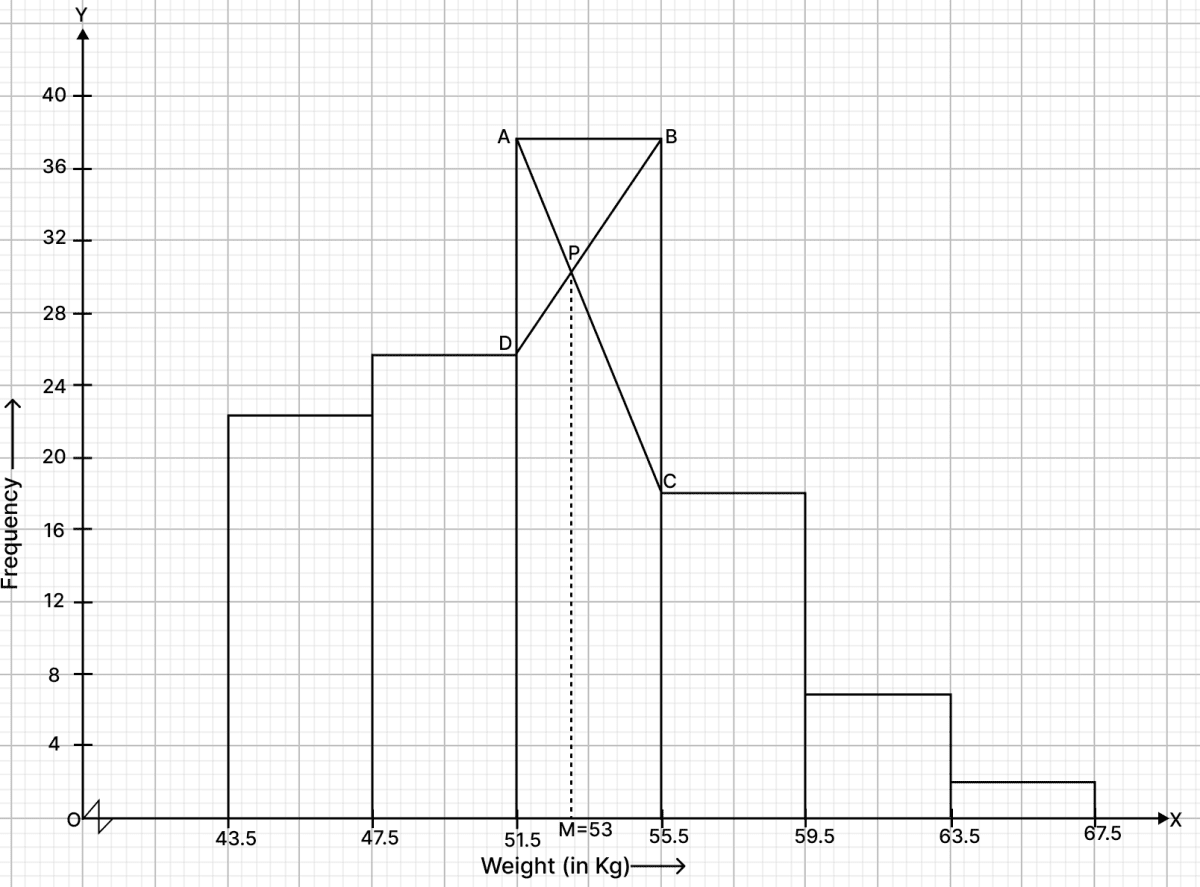
Hence, the required mode = 53.
Using a graph paper, draw a histogram for the given distribution showing the number of runs scored by 50 batsmen. From the histogram, estimate the mode of the data:
| Runs scored | No. of batsmen |
|---|---|
| 3000 - 4000 | 4 |
| 4000 - 5000 | 18 |
| 5000 - 6000 | 9 |
| 6000 - 7000 | 6 |
| 7000 - 8000 | 7 |
| 8000 - 9000 | 2 |
| 9000 - 10000 | 4 |
Answer
Steps :
Take 1 cm along x-axis = 1000 runs and 1 cm along y-axis = 4(batsman).
Construct rectangles corresponding to the given data.
In highest rectangle, draw two st. lines AC and BD from corners of the rectangles on either side of the highest rectangle to the opposite corners of the highest rectangle. Let P be the point of intersection of AC and BD.
Through P, draw a vertical line to meet the x-axis at M. The abscissa of the point M represents 4600.
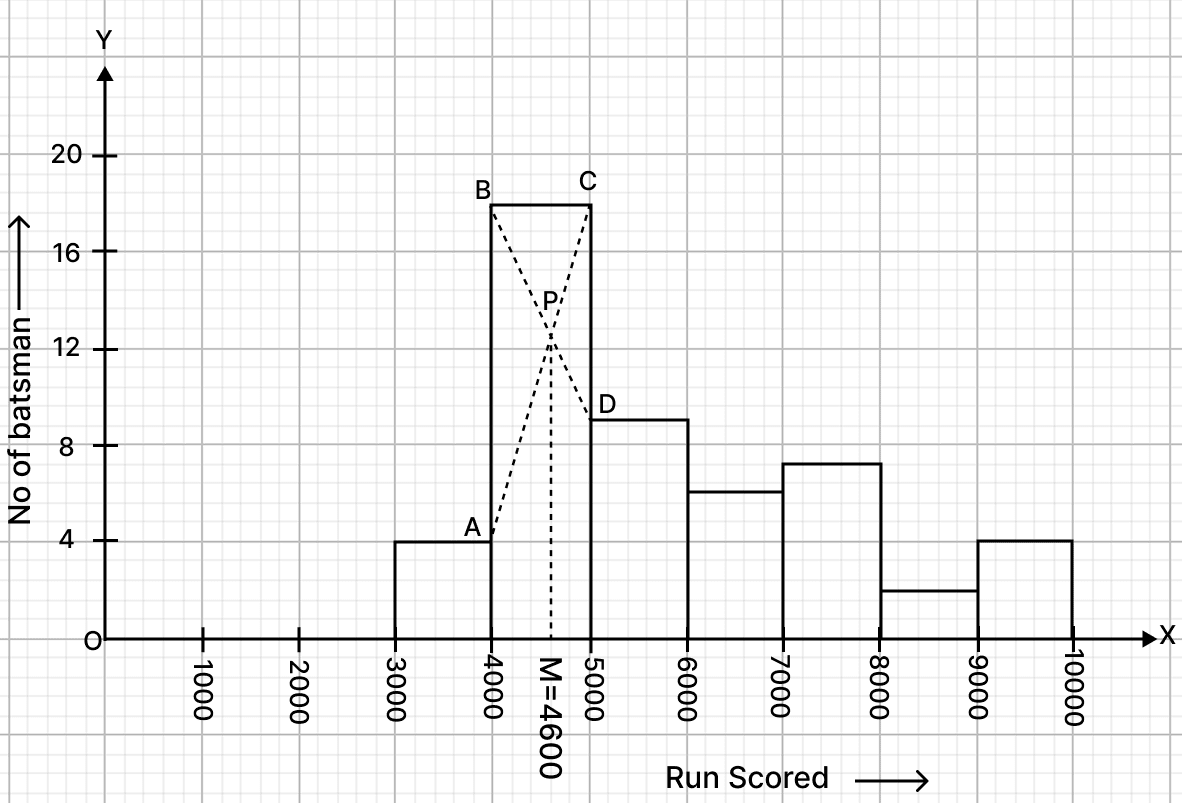
Hence, the required mode = 4600 runs.
Draw a histogram for the given data, using a graph paper.
| Weekly wages (in ₹) | No. of people |
|---|---|
| 3000 - 4000 | 4 |
| 4000 - 5000 | 9 |
| 5000 - 6000 | 18 |
| 6000 - 7000 | 6 |
| 7000 - 8000 | 7 |
| 8000 - 9000 | 2 |
| 9000 - 10000 | 4 |
Estimate the mode from the graph.
Answer
Steps :
Take 1 cm along x-axis = 1000 rupees and 1 cm along y-axis = 2 (No. of people).
Construct rectangles corresponding to the given data.
In highest rectangle, draw two straight lines AD and BC from corners of the rectangles on either side of the highest rectangle to the opposite corners of the highest rectangle. Let P be the point of intersection of AD and BC.
Through P, draw a vertical line to meet the x-axis at M. The abscissa of the point M represents 5400.
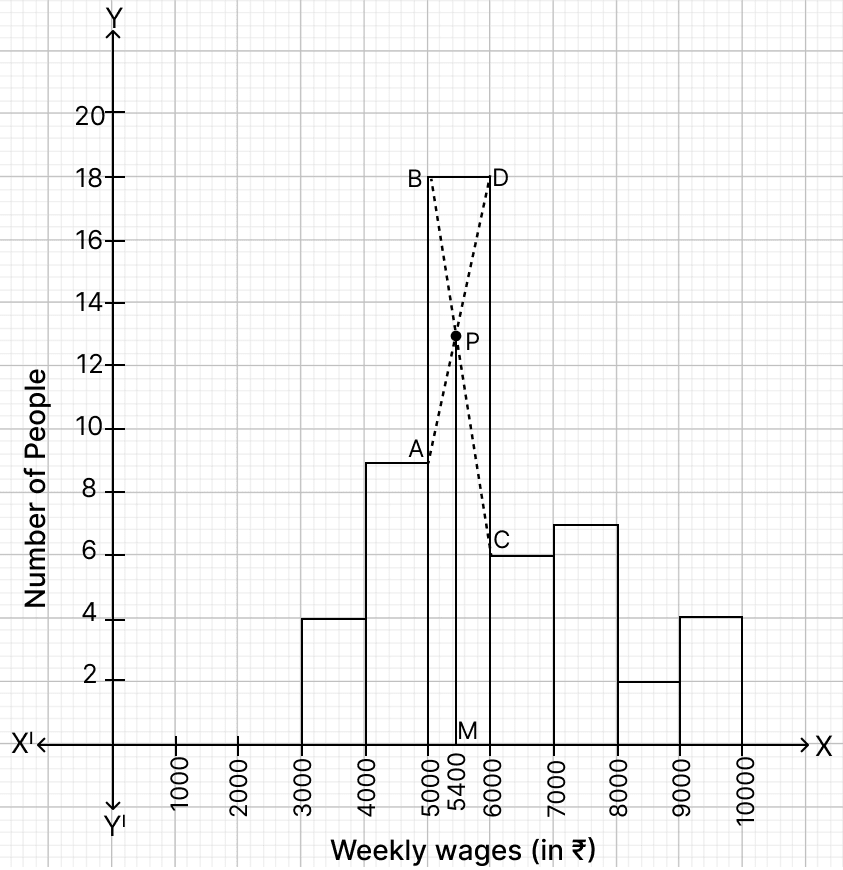
Hence, mode = ₹ 5,400.
Marks obtained by 100 students in an examination are given below:
| Marks | No. of students |
|---|---|
| 0 - 10 | 5 |
| 10 - 20 | 15 |
| 20 - 30 | 20 |
| 30 - 40 | 28 |
| 40 - 50 | 20 |
| 50 - 60 | 12 |
Draw a histogram for the given data using a graph paper and find the mode. Take 2 cm = 10 marks along one axis and 2 cm = 10 students along the other axis.
Answer
Steps :
Take 2 cm along x-axis = 10 marks and 2 cm along y-axis = 10 students (frequency).
Construct rectangles corresponding to the given data.
In highest rectangle, draw two straight lines AC and BD from corners of the rectangles on either side of the highest rectangle to the opposite corners of the highest rectangle. Let P be the point of intersection of AC and BD.
Through P, draw a vertical line to meet the x-axis at M. The abscissa of the point M represents 35.
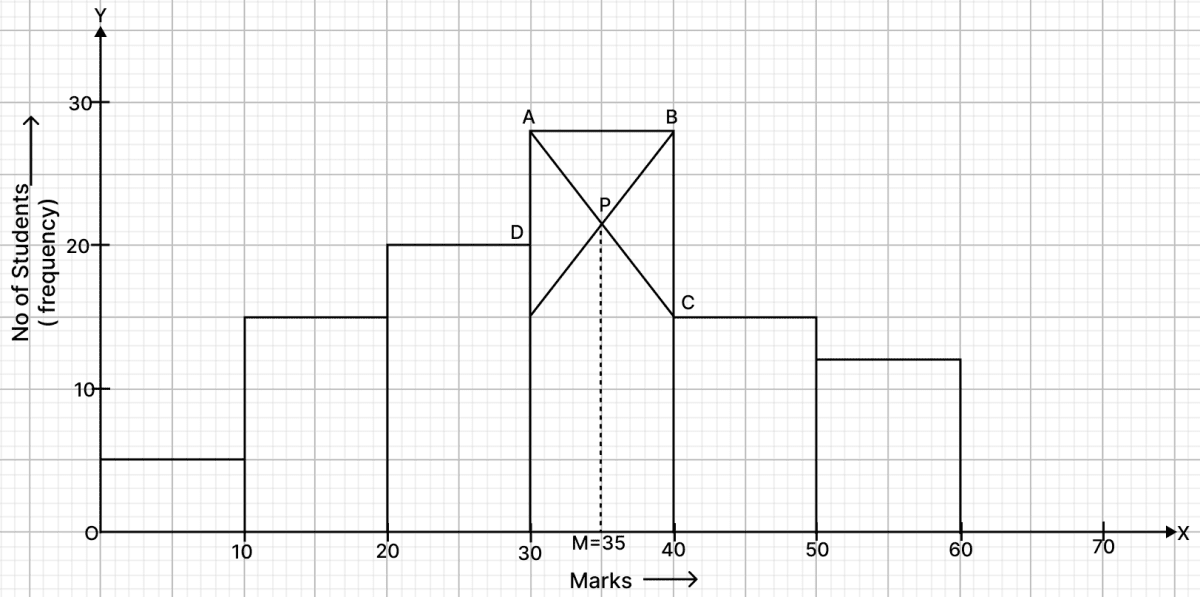
Hence, the required mode = 35.
The following distribution gives the daily wages of 60 workers of a factory.
| Daily Income (in ₹) | Number of Workers (f) |
|---|---|
| 200 - 300 | 6 |
| 300 - 400 | 10 |
| 400 - 500 | 14 |
| 500 - 600 | 16 |
| 600 - 700 | 10 |
| 700 - 800 | 4 |
Use graph paper to answer this question.
Take 2 cm = ₹ 100 along one axis and 2 cm = 2 workers along the other axis. Draw a histogram and hence find the mode of the given distribution.
Answer
Steps of construction :
Draw a histogram of the given distribution.
Inside the highest rectangle, which represents the maximum frequency (or modal class), draw two lines AC and BD diagonally from the upper corners C and D of adjacent rectangles.
Through the point K (the point of intersection of diagonals AC and BD), draw KL perpendicular to the horizontal axis.
The value of point L on the horizontal axis represents the value of mode.
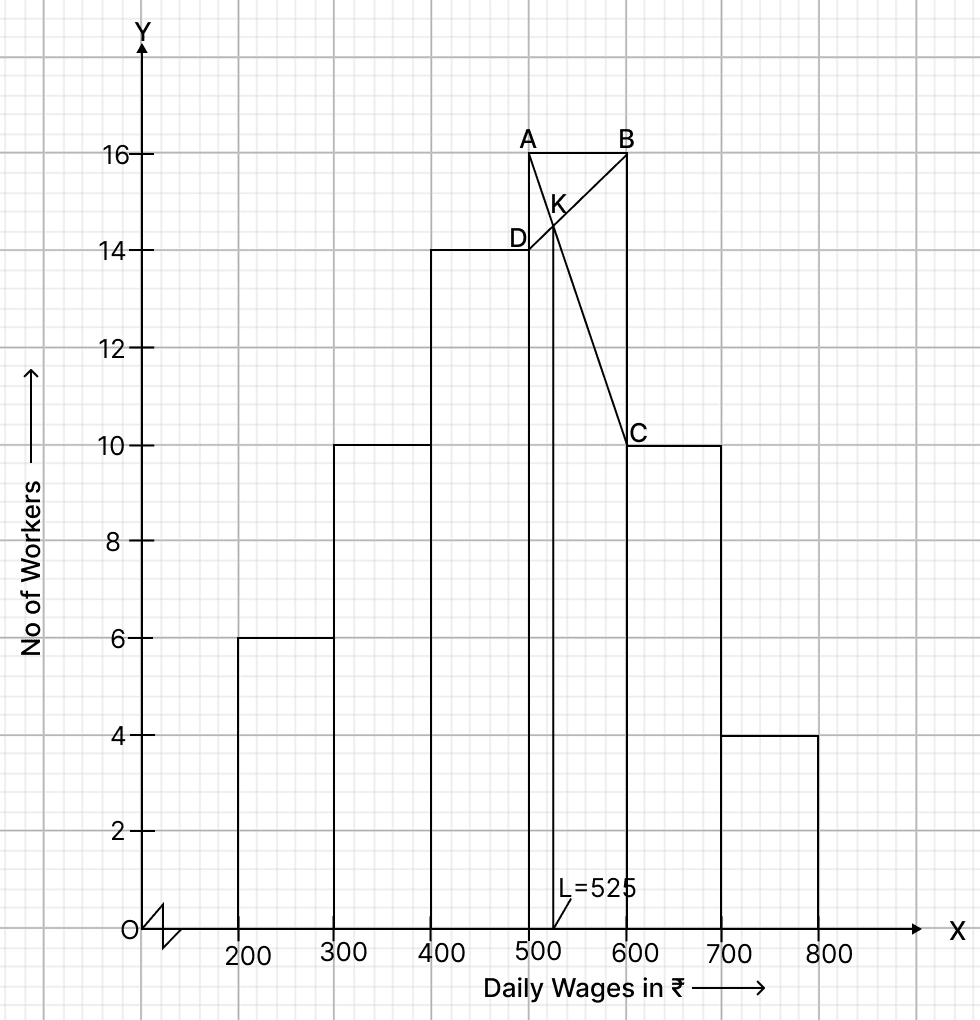
From graph,
L = ₹ 525
Hence, required mode = ₹ 525.
The table given below shows a record of the weight in kg of 200 students of a school.
| Weight (kg) | Number of students |
|---|---|
| 40 - 45 | 8 |
| 45 - 50 | 19 |
| 50 - 55 | 24 |
| 55 - 60 | 45 |
| 60 - 65 | 51 |
| 65 - 70 | 31 |
| 70 - 75 | 22 |
Draw a histogram and find the modal weight.
[Take 2 cm = 5 kg along one axis and 2 cm = 5 students along the other axis]
Answer
Steps of Construction:
Draw a histogram of the given distribution.
Inside the highest rectangle, which represents the maximum frequency (the modal class 60-65), draw two lines AC and BD diagonally from the upper corners C and D of the adjacent rectangles (50-55 and 65-70) to the top corners of the modal rectangle.
Through the point K (the point of intersection of diagonals AC and BD), draw KL perpendicular to the horizontal axis.
The value of point L on the horizontal axis represents the value of the mode.
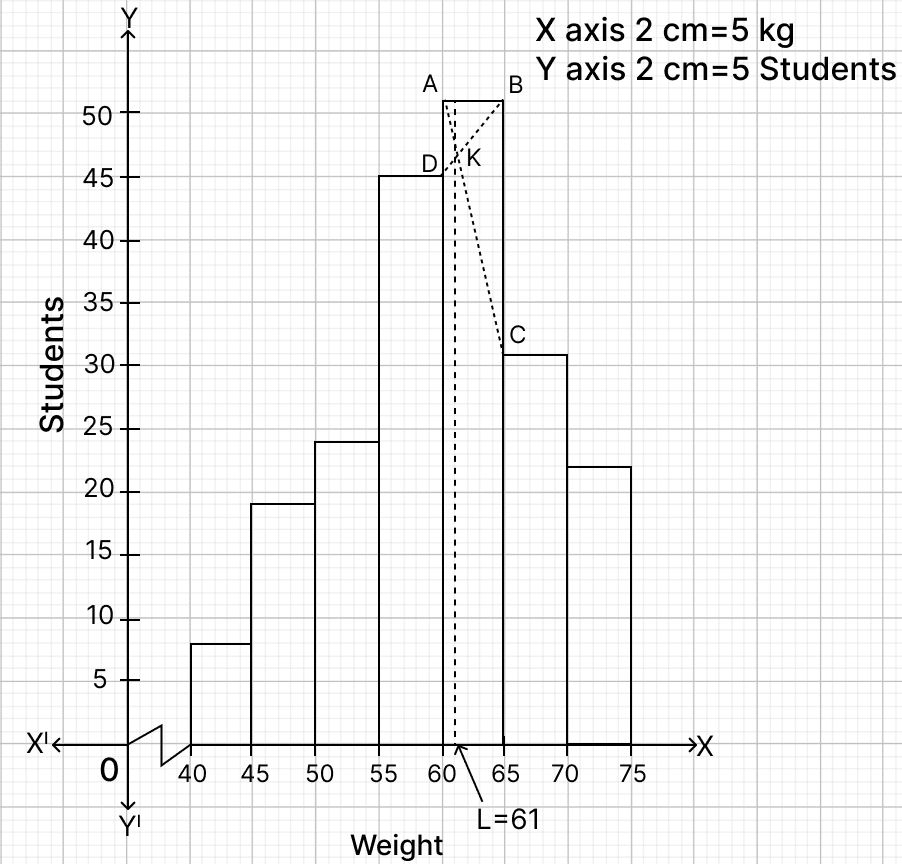
From graph,
L = 61.
Hence, modal weight = 61 kg.
The given graph with a histogram represents the number of plants of different heights grown in a school campus. Study the graph carefully and answer the following questions :

(i) Make a frequency table with respect to the class boundaries and their corresponding frequencies.
(ii) State the modal class.
(iii) Identify and note down the mode of the distribution.
(iv) Find the number of plants whose height range is between 80 cm to 90 cm.
Answer
(i) Frequency table :
| Height (class) | Number of plants |
|---|---|
| 30-40 | 4 |
| 40-50 | 2 |
| 50-60 | 8 |
| 60-70 | 12 |
| 70-80 | 6 |
| 80-90 | 3 |
| 90-100 | 4 |
(ii) From graph,
The modal class is 60-70.
(iii) From graph,
The mode = 64.
(iv) From graph,
The number of plants whose height range is between 80 cm to 90 cm are 3.
Study the graph given below and answer the following:

(i) Number of batsmen who scored 500 to 700 runs
(ii) Modal class interval
(iii) The value of mode
Answer
(i) From histogram,
The number of batsmen who scored between 500 and 600 runs is 3.
The number of batsmen who scored between 600 and 700 runs is 2.
Thus, the total number of batsmen who scored 500 to 700 runs is 3 + 2 = 5.
Hence, number of batsmen who scored 500 to 700 runs = 5.
(ii) The modal class is the class with the highest frequency.
Hence, the modal class interval is 400 - 500.
(iii) From graph,
Mode = 430.
Hence, mode = 430.