
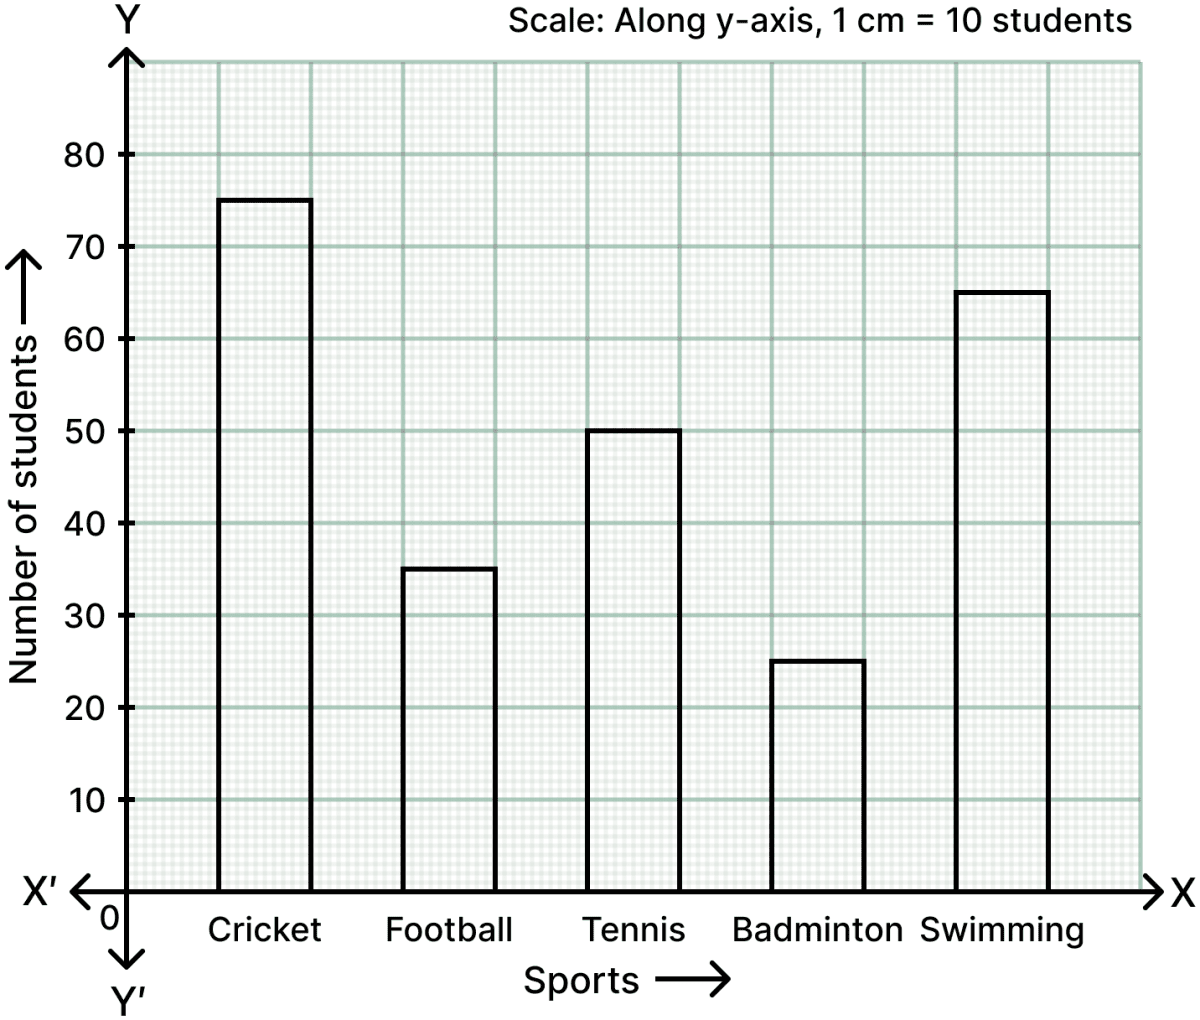
The following table shows the favourite sports of 250 students in a school.
| Sports | Number of students |
|---|---|
| Cricket | 75 |
| Football | 35 |
| Tennis | 50 |
| Badminton | 25 |
| Swimming | 65 |
Represent the above data by a column graph.
Answer
Steps:
- On a graph paper, draw two mutually perpendicular lines OX and OY which intersect each other at point O.
The line OX is taken horizontal and is called the x-axis, whereas the line OY is taken vertical and is called the y-axis.
On the x-axis, starting from O, mark points at equal distances. At these points write the different sports given. In this question, the sports are Cricket, Football, Tennis, Badminton and Swimming.
Along y-axis, mark the heights of the bars (rectangles) in proportion to the given data (number of students). Along the y-axis, take 1 cm to represent 10 students.
The required column graph is as given below:
The birth rate per thousand of five countries over a period of time is shown below:
| Country | Birth rate per thousand |
|---|---|
| China | 42 |
| India | 35 |
| Germany | 14 |
| U.K. | 28 |
| Sweden | 21 |
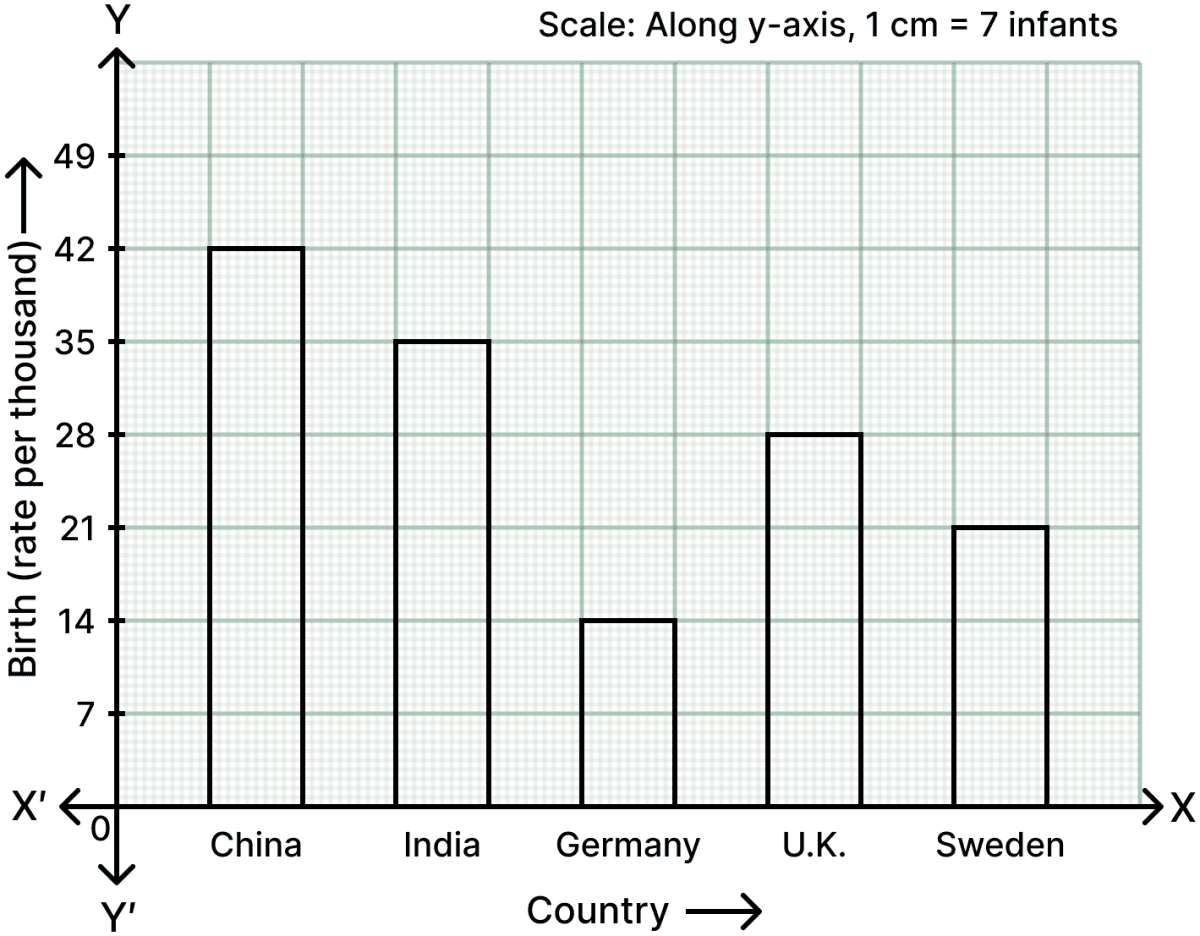
Represent the above data by a bar graph.
Answer
Steps:
- On a graph paper, draw two mutually perpendicular lines OX and OY which intersect each other at point O.
The line OX is taken horizontal and is called the x-axis, whereas the line OY is taken vertical and is called the y-axis.
On the x-axis, starting from O, mark points at equal distances. At these points write the different countries given. In this question, the countries are China, India, Germany, U.K. and Sweden.
Along y-axis, mark the heights of the bars (rectangles) in proportion to the given data (birth rate per thousand). Along the y-axis, take 1 cm to represent 7 infants (i.e. a birth rate of 7 per thousand).
The required bar graph is as given below:
The marks obtained by a student in his annual examinations in various subjects are given below:
| Subject | Marks obtained |
|---|---|
| Hindi | 75 |
| Maths | 40 |
| English | 50 |
| Science | 85 |
| S.Studies | 35 |
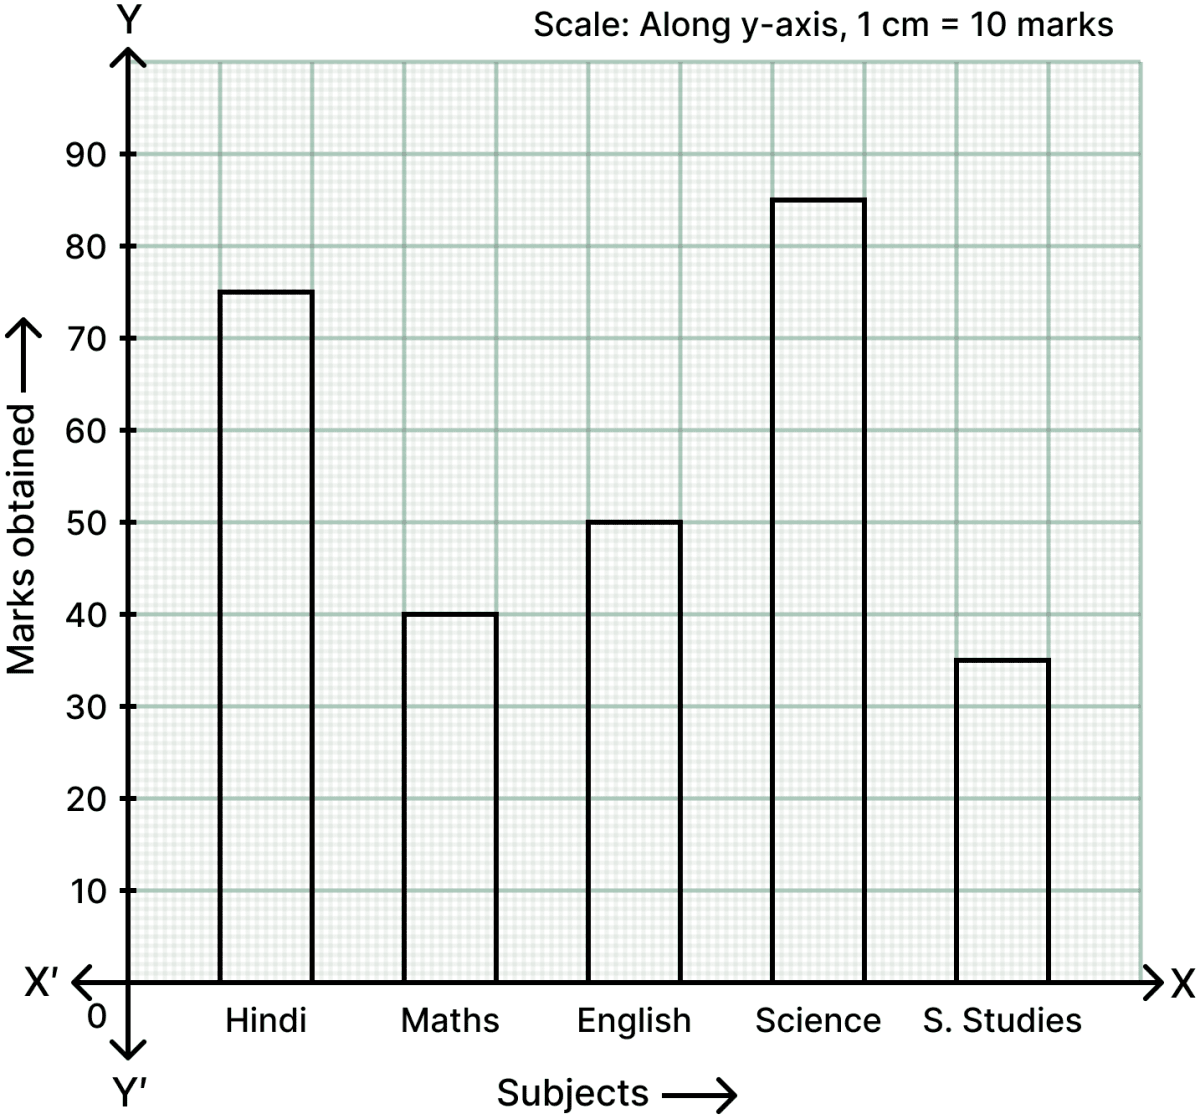
Represent the above data by a bar graph.
Answer
Steps:
- On a graph paper, draw two mutually perpendicular lines OX and OY which intersect each other at point O.
The line OX is taken horizontal and is called the x-axis, whereas the line OY is taken vertical and is called the y-axis.
On the x-axis, starting from O, mark points at equal distances. At these points write the different subjects given. In this question, the subjects are Hindi, Maths, English, Science and S.Studies.
Along y-axis, mark the heights of the bars (rectangles) in proportion to the given data (marks obtained). Along the y-axis, take 1 cm to represent 10 marks.
The required bar graph is as given below:
The table given below depicts the monthly salary (in ₹) of six employees of a company:
| Employee | Monthly salary (₹) |
|---|---|
| A | 2000 |
| B | 3500 |
| C | 4000 |
| D | 3000 |
| E | 2500 |
| F | 4500 |
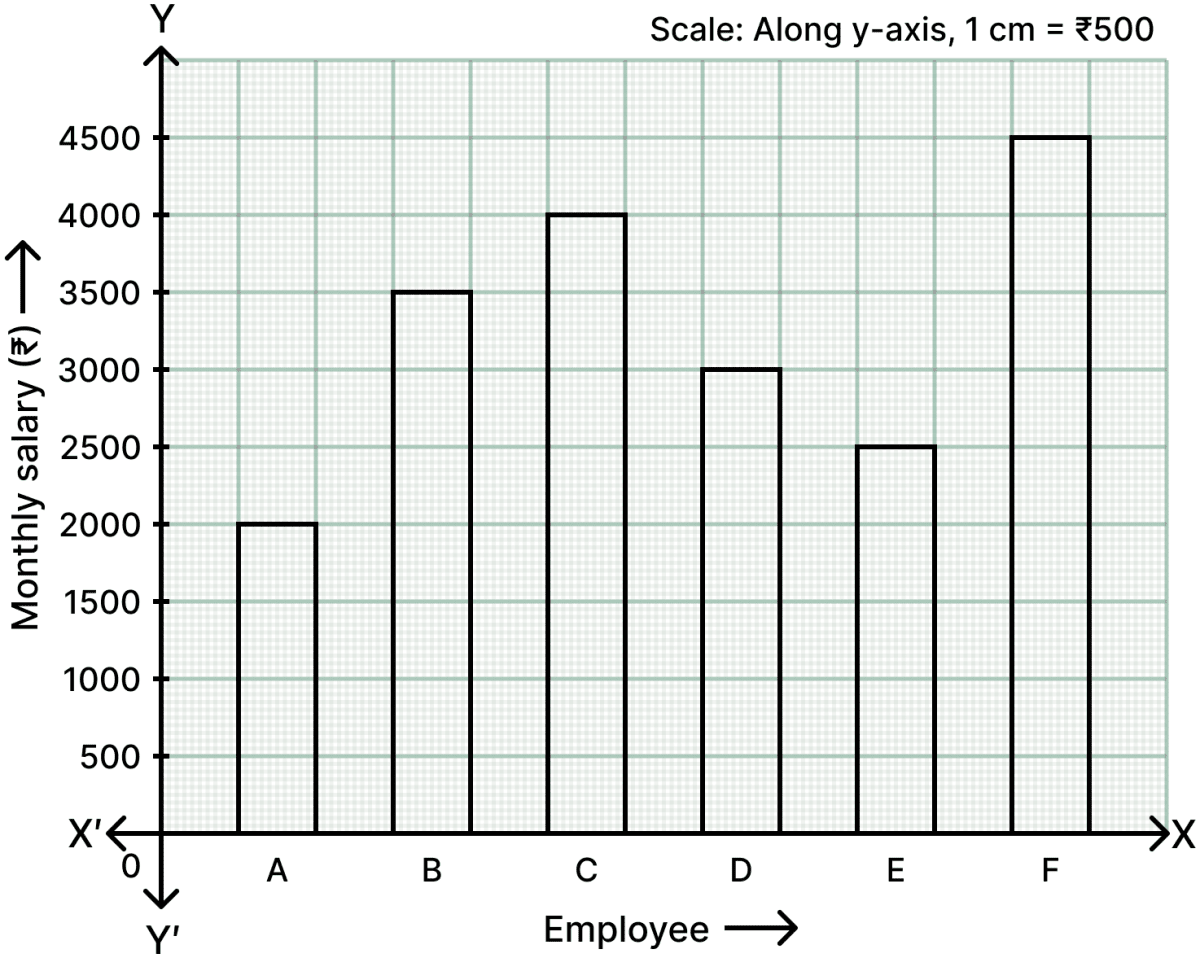
Represent the above data by a column graph.
Answer
Steps:
- On a graph paper, draw two mutually perpendicular lines OX and OY which intersect each other at point O.
The line OX is taken horizontal and is called the x-axis, whereas the line OY is taken vertical and is called the y-axis.
On the x-axis, starting from O, mark points at equal distances. At these points write the different employees given. In this question, the employees are A, B, C, D, E and F.
Along y-axis, mark the heights of the bars (rectangles) in proportion to the given data (monthly salary in ₹). Along the y-axis, take 1 cm to represent a salary of ₹ 500.
The required column graph is as given below:
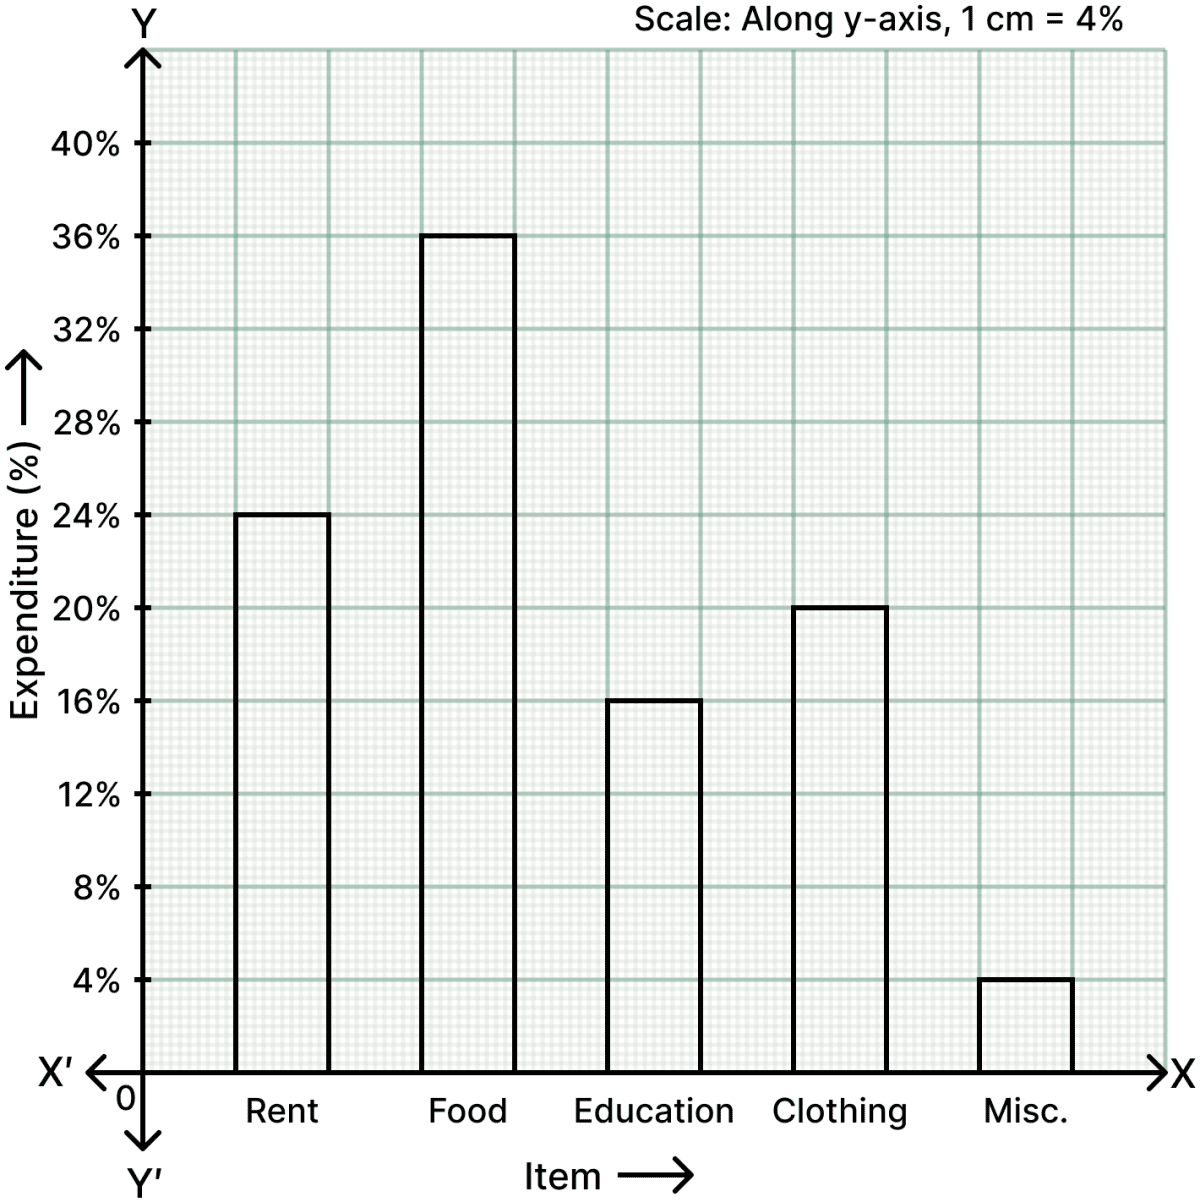
The table given below shows the monthly expenditure (in percentage) on various items, in a family.
| Item | Expenditure (in percentage) |
|---|---|
| Rent | 24% |
| Food | 36% |
| Education | 16% |
| Clothing | 20% |
| Misc. | 4% |
Represent the above data by a column graph.
Answer
Steps:
- On a graph paper, draw two mutually perpendicular lines OX and OY which intersect each other at point O.
The line OX is taken horizontal and is called the x-axis, whereas the line OY is taken vertical and is called the y-axis.
On the x-axis, starting from O, mark points at equal distances. At these points write the different items given. In this question, the items are Rent, Food, Education, Clothing and Misc.
Along y-axis, mark the heights of the bars (rectangles) in proportion to the given data (expenditure in percentage). Along the y-axis, take 1 cm to represent 4%.
The required column graph is as given below:
Read the given column graph and answer the questions that follow:
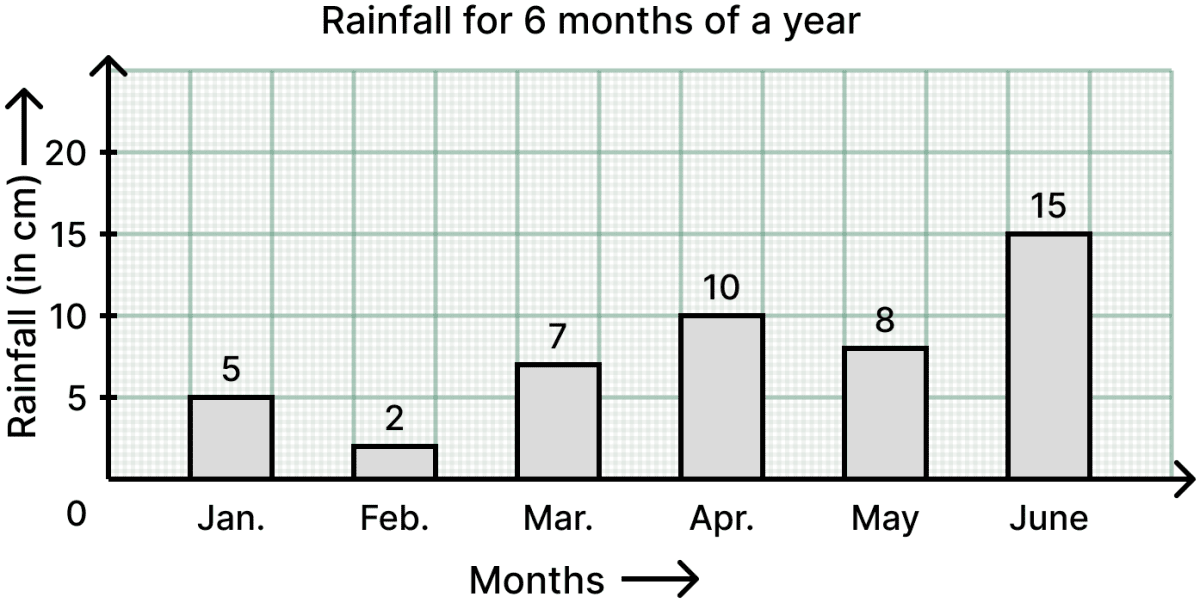
(i) What information is represented by the column graph?
(ii) In which month was the rainfall maximum?
(iii) Which month was the driest?
(iv) What was the rainfall in March?
(v) Find the total amount of rainfall in all the six months taken together.
Answer
From the column graph, the rainfall in the six months is :
Jan. = 5 cm, Feb. = 2 cm, Mar. = 7 cm, Apr. = 10 cm, May = 8 cm and June = 15 cm.
(i) The column graph shows the rainfall (in cm) month-wise from January to June.
Hence, the column graph represents the rainfall (in cm) at a place during the first six months of a year.
(ii) The maximum rainfall is 15 cm, which is in June.
Hence, the rainfall was maximum in June.
(iii) The least rainfall is 2 cm, which is in February.
Hence, February was the driest month.
(iv) The height of the column against March is 7 cm.
Hence, the rainfall in March was 7 cm.
(v) Total amount of rainfall in the six months = (5 + 2 + 7 + 10 + 8 + 15) cm
= 47 cm
Hence, the total amount of rainfall in all the six months taken together is 47 cm.
Read the column graph given below:
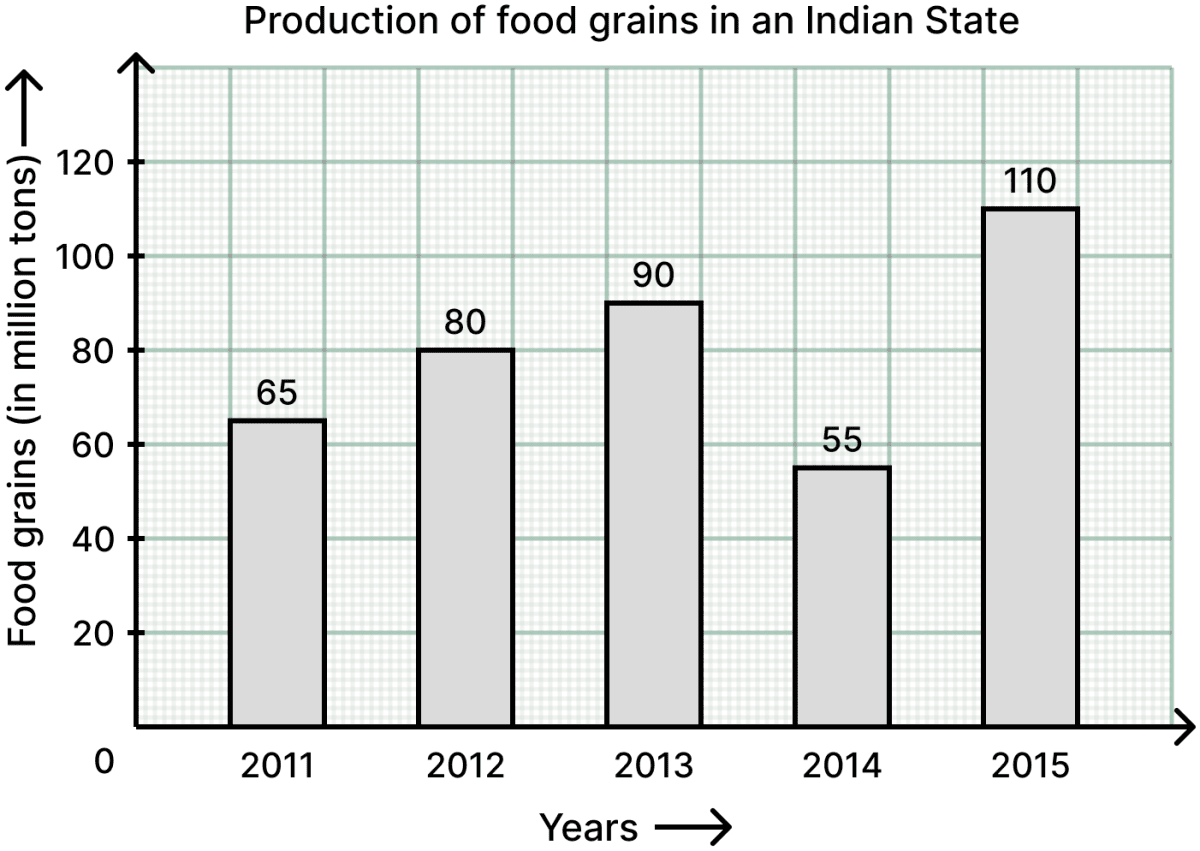
Now, answer the following questions:
(i) What information is represented by the column graph?
(ii) What was the production of food grains in 2013?
(iii) In which year the production was maximum?
(iv) After which year there was a sudden fall in the production?
(v) Find the percentage increase in the production of food grains in the year 2015.
Answer
From the column graph, the production of food grains (in million tons) is :
2011 = 65, 2012 = 80, 2013 = 90, 2014 = 55 and 2015 = 110.
(i) The column graph shows the production of food grains (in million tons) year-wise from 2011 to 2015.
Hence, the column graph represents the production of food grains in an Indian state during the years 2011 to 2015.
(ii) The height of the column against 2013 is 90.
Hence, the production of food grains in 2013 was 90 million tons.
(iii) The maximum production is 110 million tons, which is in 2015.
Hence, the production was maximum in the year 2015.
(iv) The production fell from 90 million tons in 2013 to 55 million tons in 2014.
Hence, there was a sudden fall in the production after the year 2013.
(v) Production in 2014 = 55 million tons
Production in 2015 = 110 million tons
Increase in production = (110 − 55) million tons
= 55 million tons
∴ Percentage increase = %
= 100%
Hence, the percentage increase in the production of food grains in the year 2015 is 100%.
In a survey of 130 families of a colony, the number of children in each family was recorded and the data has been represented by the bar graph, given below:
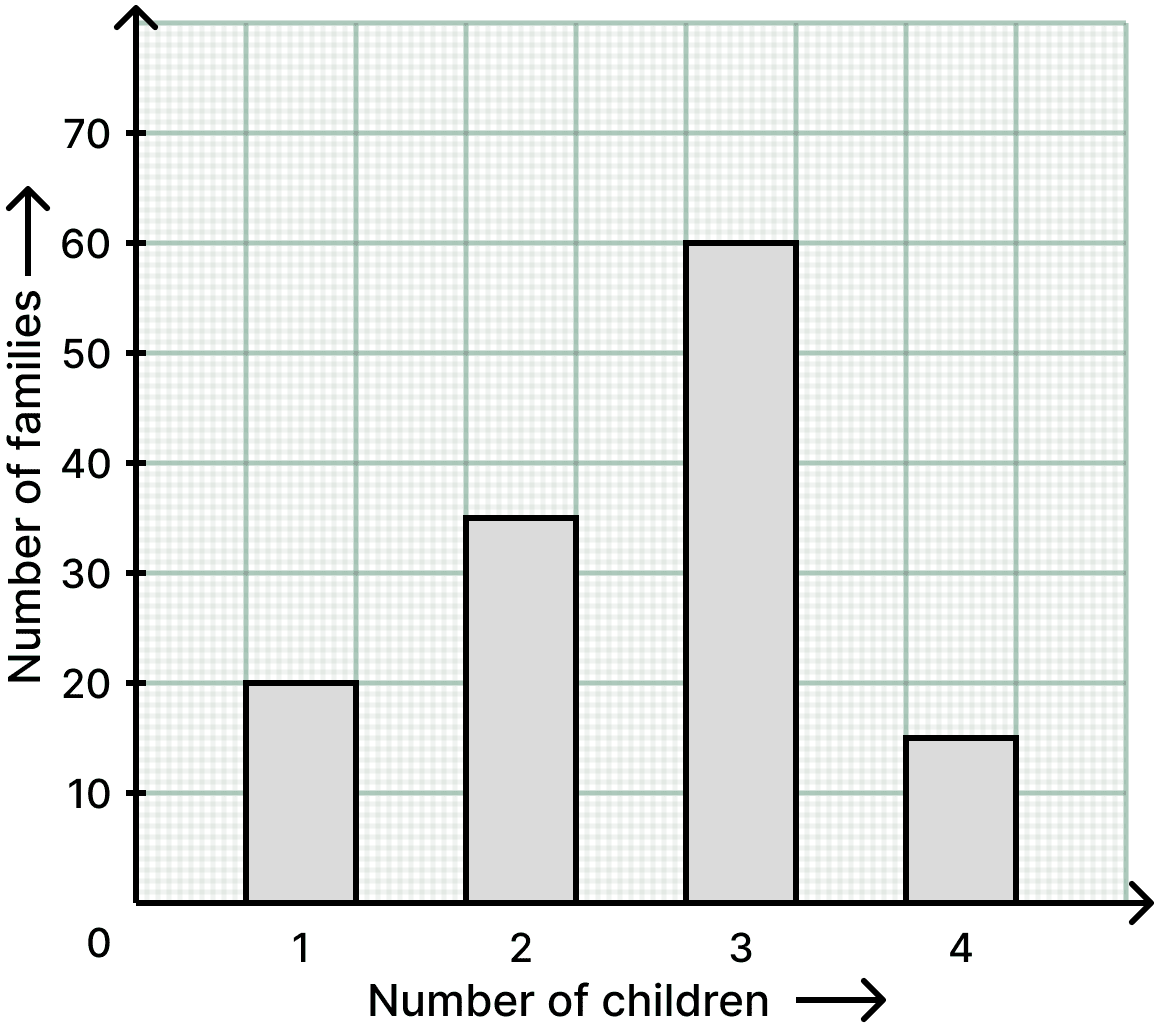
Read the bar graph carefully and answer the questions given below:
(i) What information does the bar graph give?
(ii) How many families have 2 children?
(iii) How many families have no child?
(iv) What percentage of families have 4 children?
Answer
From the bar graph, the number of families having 1, 2, 3 and 4 children are 20, 35, 60 and 15 respectively.
(i) The bar graph shows the number of families against the number of children in each family.
Hence, the bar graph gives the number of children in each of the 130 families of a colony.
(ii) The height of the bar against 2 children is 35.
Hence, 35 families have 2 children.
(iii) Number of families having one or more children = 20 + 35 + 60 + 15
= 130
∴ Number of families having no child = 130 − 130
= 0
Hence, there is no family with no child, i.e. 0 families.
(iv) Number of families having 4 children = 15
∴ Required percentage = %
= %
= %
Hence, % of the families have 4 children.