
The following pictograph depicts the number of TVs sold by an electronics shop during a certain week:
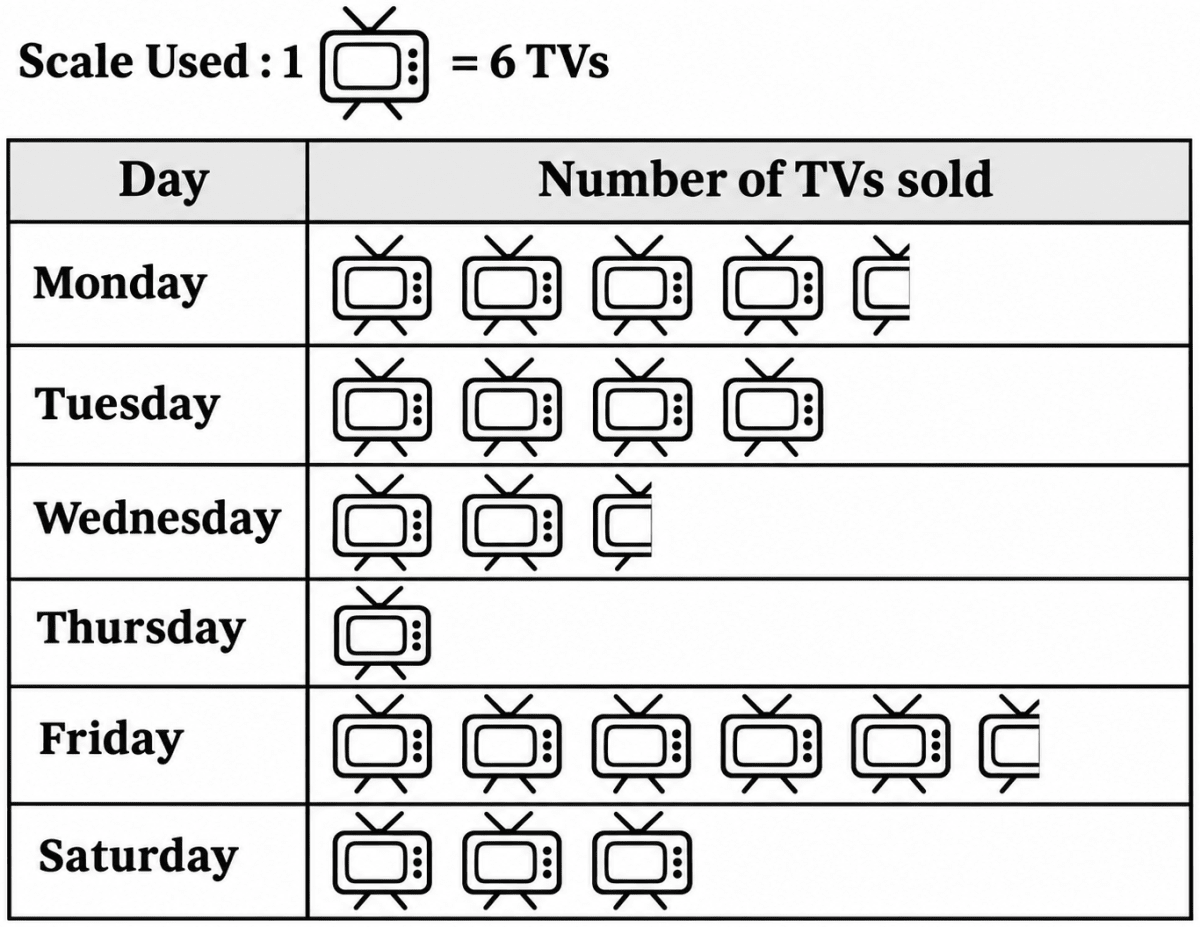
Look at the pictograph and answer the questions given below:
The maximum number of TVs were sold on:
(a) Saturday
(b) Tuesday
(c) Friday
(d) MondayBy what percent is the maximum number of TVs sold in a day greater than the minimum number of TVs sold in a day?
(a) 450%
(b) 500%
(c) 400%
(d) 550%The ratio of the number of TVs sold on Monday to that sold on ...... is 3 : 2.
(a) Thursday
(b) Tuesday
(c) Wednesday
(d) SaturdayThe percentage decline in sale from Tuesday to Wednesday is:
(a) 20%
(b) 37.5%
(c) 35%
(d) 25%
Answer
1. From the pictograph, the number of TV symbols against each day is :
Monday = , Tuesday = 4, Wednesday = , Thursday = 1, Friday = and Saturday = 3.
The maximum number of symbols is against Friday, i.e. symbols.
∴ Number of TVs sold on Friday =
= 33, which is the maximum.
Hence, option (c) is the correct option.
2. Maximum number of TVs sold in a day (i.e. on Friday) =
= 33
Minimum number of TVs sold in a day (i.e. on Thursday) = 1 × 6
= 6
∴ Required percentage = %
= %
= 450%
Hence, option (a) is the correct option.
3. Number of TVs sold on Monday =
= 27
Let the number of TVs sold on the required day be .
Given,
Number of TVs sold on Saturday = 3 × 6
= 18
∴ The required day is Saturday.
Hence, option (d) is the correct option.
4. Number of TVs sold on Tuesday = 4 × 6
= 24
Number of TVs sold on Wednesday =
= 15
Decline in sale = 24 − 15
= 9
∴ Percentage decline = %
= 37.5%
Hence, option (b) is the correct option.
The following graph represents the production of fertilisers (in 10000 tonnes) by company X from 2014 to 2019.
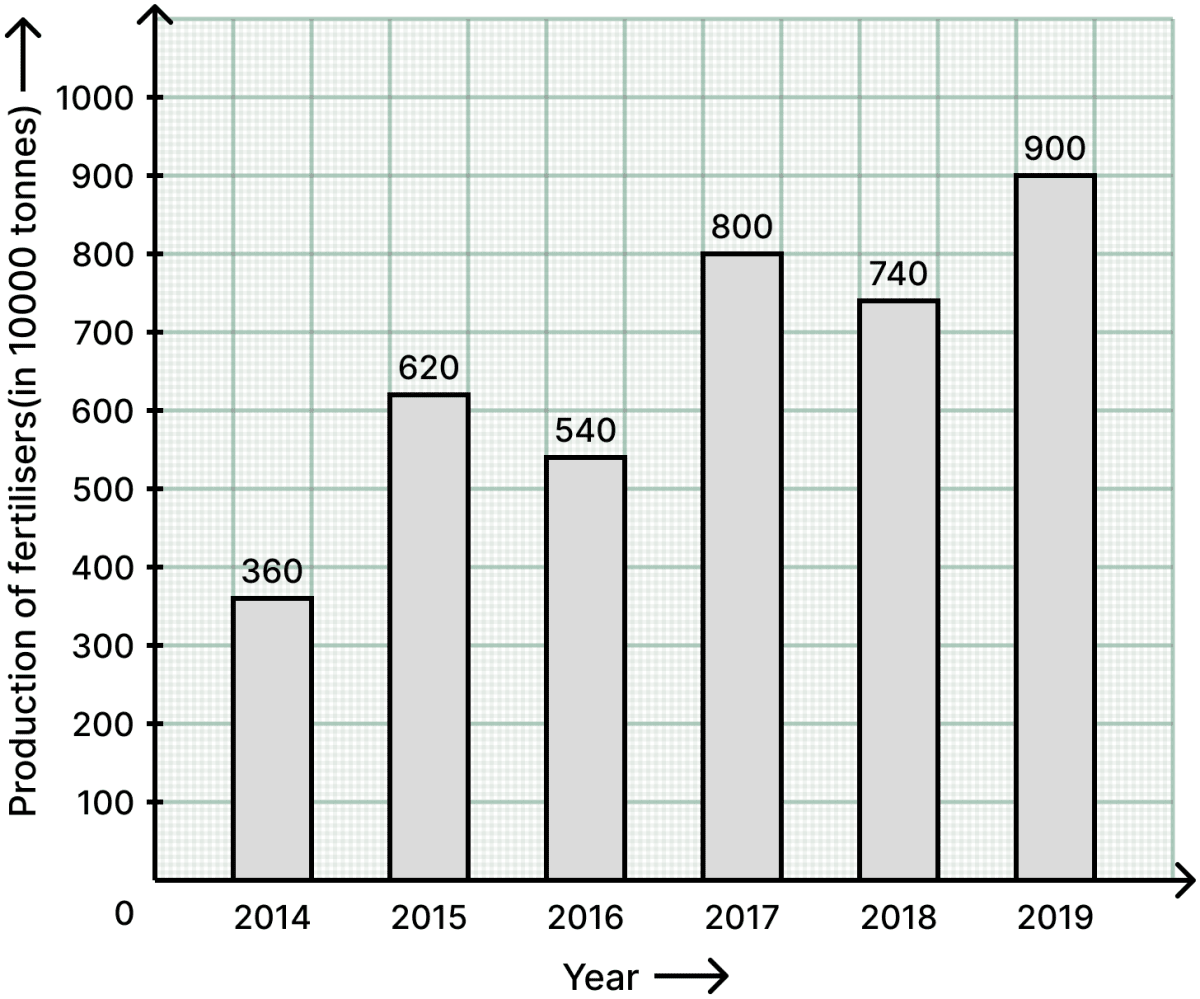
Study the above information and answer the questions given below:
The ratio of the highest to the lowest production is:
(a) 5 : 2
(b) 7 : 2
(c) 3 : 2
(d) 5 : 1The percentage increase in production of fertilisers in 2016 compared to that in the year 2014, is:
(a) 60%
(b) 50%
(c) 40%
(d) 70%The percentage decrease in production of fertilisers from 2017 to 2018, is:
(a) 5%
(b) 10%
(c) 7.5%
(d) 12.5%The number of years for which the production of fertilisers was more than the average production of the given years, is:
(a) 3
(b) 4
(c) 1
(d) 2
Answer
1. From the graph, the production of fertilisers (in 10000 tonnes) is :
2014 = 360, 2015 = 620, 2016 = 540, 2017 = 800, 2018 = 740 and 2019 = 900.
Highest production (in 2019) = 900
Lowest production (in 2014) = 360
∴ Required ratio =
=
= 5 : 2
Hence, option (a) is the correct option.
2. Production in 2014 = 360
Production in 2016 = 540
Increase in production = 540 − 360
= 180
∴ Percentage increase = %
= 50%
Hence, option (b) is the correct option.
3. Production in 2017 = 800
Production in 2018 = 740
Decrease in production = 800 − 740
= 60
∴ Percentage decrease = %
= 7.5%
Hence, option (c) is the correct option.
4. Sum of the productions of all the years = 360 + 620 + 540 + 800 + 740 + 900
= 3960
and, number of years = 6
∴ Average production =
= 660
The production was more than 660 in the years 2017 (800), 2018 (740) and 2019 (900).
∴ Number of such years = 3
Hence, option (a) is the correct option.