
The students of a school washed cars every Sunday for a month to raise money for the flood affected people.
The students charged ₹100 for each car they washed. The pictograph below shows the total number of cars washed by the students.
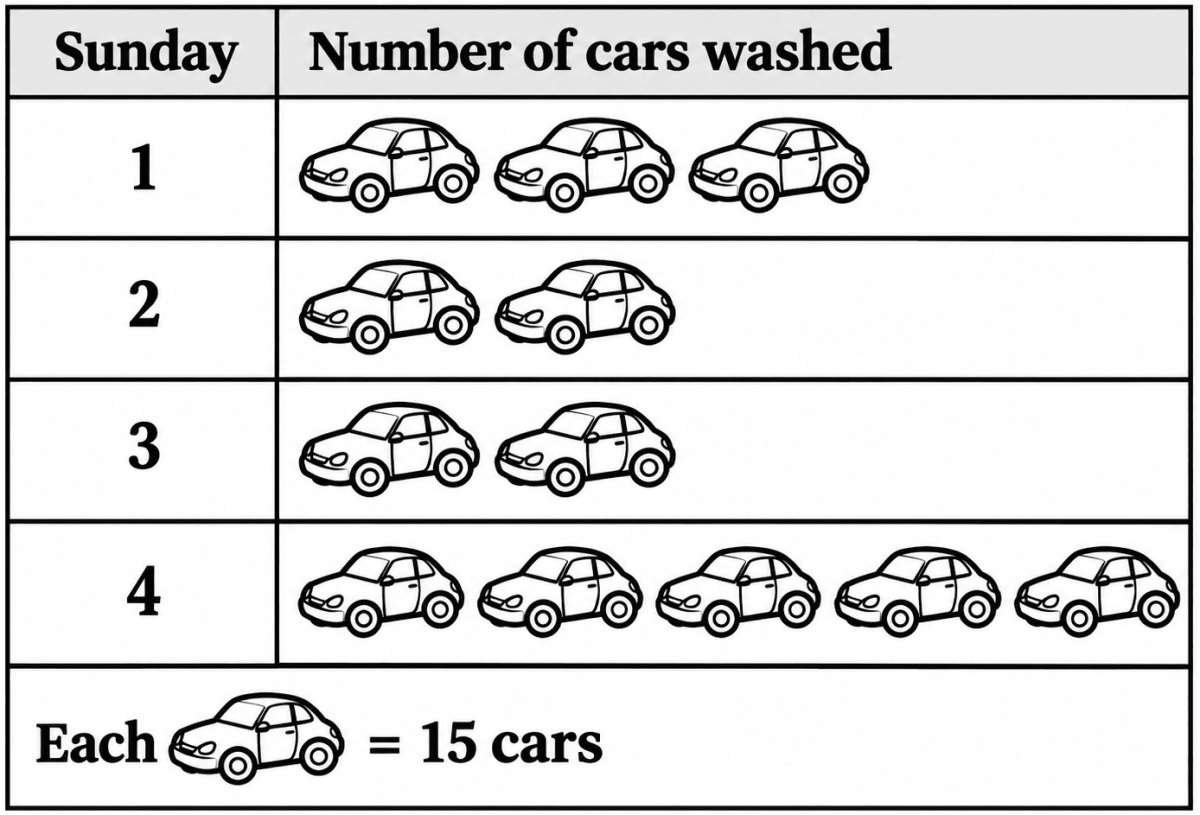
What is the total amount of money raised by the students?
₹12000
₹18000
₹55000
₹16000
Answer
From the pictograph, the number of car symbols against the four Sundays are 3, 2, 2 and 5 respectively.
Since each symbol represents 15 cars,
Total number of cars washed = (3 + 2 + 2 + 5) × 15
= 12 × 15
= 180
Amount charged for each car = ₹ 100
∴ Total amount of money raised = 180 × ₹ 100
= ₹ 18000
Hence, option 2 is the correct option.
The sale of the number of notebooks on different days of a week is shown below. Study the pictograph carefully and answer the following question.
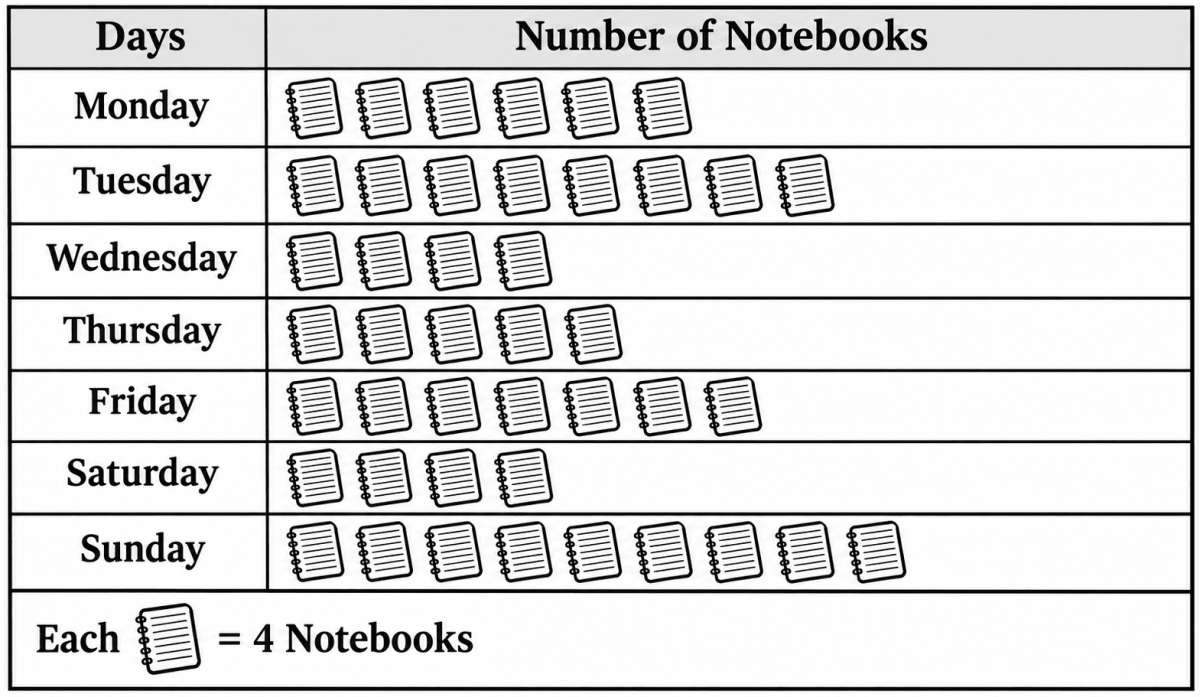
How many more notebooks were sold on Friday than on Wednesday?
4
12
8
16
Answer
From the pictograph, the number of notebook symbols against Friday and Wednesday are 7 and 4 respectively.
Since each symbol represents 4 notebooks,
More notebooks sold on Friday than on Wednesday = (7 − 4) × 4
= 3 × 4
= 12
Hence, option 2 is the correct option.
The sale of the number of notebooks on different days of a week is shown below. Study the pictograph carefully and answer the following question.
If one notebook was sold for ₹70, then what was the total earnings on Tuesday?
₹2,300
₹6,500
₹1,800
₹2,240
Answer
From the pictograph, the number of notebook symbols against Tuesday is 8.
∴ Number of notebooks sold on Tuesday = 8 × 4
= 32
Selling price of one notebook = ₹ 70
∴ Total earnings on Tuesday = 32 × ₹ 70
= ₹ 2,240
Hence, option 4 is the correct option.
9
10
12
None of these
Answer
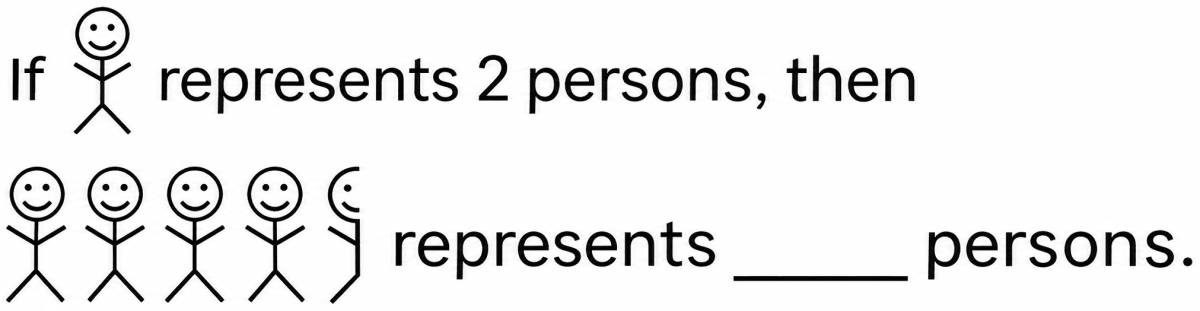
One symbol represents 2 persons.
The given figure has symbols.
∴ Number of persons represented =
= 9
Hence, option 1 is the correct option.