
Each student from the group of 40 students was asked to roll a die independently. The results are given below :
2, 3, 3, 4, 1, 5, 2, 6, 1, 4, 2, 3, 4, 4, 6, 1, 5, 5, 2, 4, 5, 5, 3, 1, 6, 5, 4, 2, 3, 6, 1, 1, 4, 4, 5, 3, 2, 2, 6, 6
Make a frequency distribution table for the same.
Answer
The numbers appearing on the die are 1, 2, 3, 4, 5 and 6. Taking the observations of the given data one at a time and marking a tally mark against the corresponding number, the frequency distribution table of the given data is:
| Number on the die (Variate) | Tally marks | Frequency (No. of students) |
|---|---|---|
| 1 | 6 | |
| 2 | 7 | |
| 3 | 6 | |
| 4 | 8 | |
| 5 | 7 | |
| 6 | 6 | |
| Total | 40 |
Hence, the required frequency distribution table is as given above.
Construct a frequency distribution table for the following weights (in grams) of 35 oranges, using class intervals 30 - 35, 35 - 40, 40 - 45, 45 - 50 and so on.
30, 40, 45, 32, 43, 50, 55, 63, 72, 73, 62, 61, 54, 53, 50, 43, 76, 38, 54, 55, 66, 70, 74, 75, 45, 47, 59, 58, 60, 63, 74, 33, 35, 70, 68.
(i) How many classes are there in the frequency distribution table?
(ii) Which weight group has the lowest frequency?
(iii) Which weight group has the highest frequency?
Answer
Here, maximum = 76 and minimum = 30.
∴ Range = 76 - 30 = 46
The classes are to be of size 5. Since we want to include 30 in the first class, 30 is the lower limit of the first class, and since we want to include 76 in the last class, 80 is the upper limit of the last class.
So, let us form 10 classes each of size 5.
The grouped frequency distribution table of the given data is:
| Weight (in grams) (Class interval) | Tally marks | Number of oranges (Frequency) |
|---|---|---|
| 30 - 35 | III | 3 |
| 35 - 40 | II | 2 |
| 40 - 45 | III | 3 |
| 45 - 50 | III | 3 |
| 50 - 55 | 5 | |
| 55 - 60 | IIII | 4 |
| 60 - 65 | 5 | |
| 65 - 70 | II | 2 |
| 70 - 75 | 6 | |
| 75 - 80 | II | 2 |
| Total | 35 |
(i) The classes are 30 - 35, 35 - 40, 40 - 45, 45 - 50, 50 - 55, 55 - 60, 60 - 65, 65 - 70, 70 - 75 and 75 - 80.
Hence, there are 10 classes in the frequency distribution table.
(ii) From the table, the frequencies are 3, 2, 3, 3, 5, 4, 5, 2, 6 and 2.
The lowest of these frequencies is 2, which corresponds to the classes 35 - 40, 65 - 70 and 75 - 80.
Hence, the weight groups 35 - 40, 65 - 70 and 75 - 80 have the lowest frequency.
(iii) From the table, the frequencies are 3, 2, 3, 3, 5, 4, 5, 2, 6 and 2.
The highest of these frequencies is 6, which corresponds to the class 70 - 75.
Hence, the weight group 70 - 75 has the highest frequency.
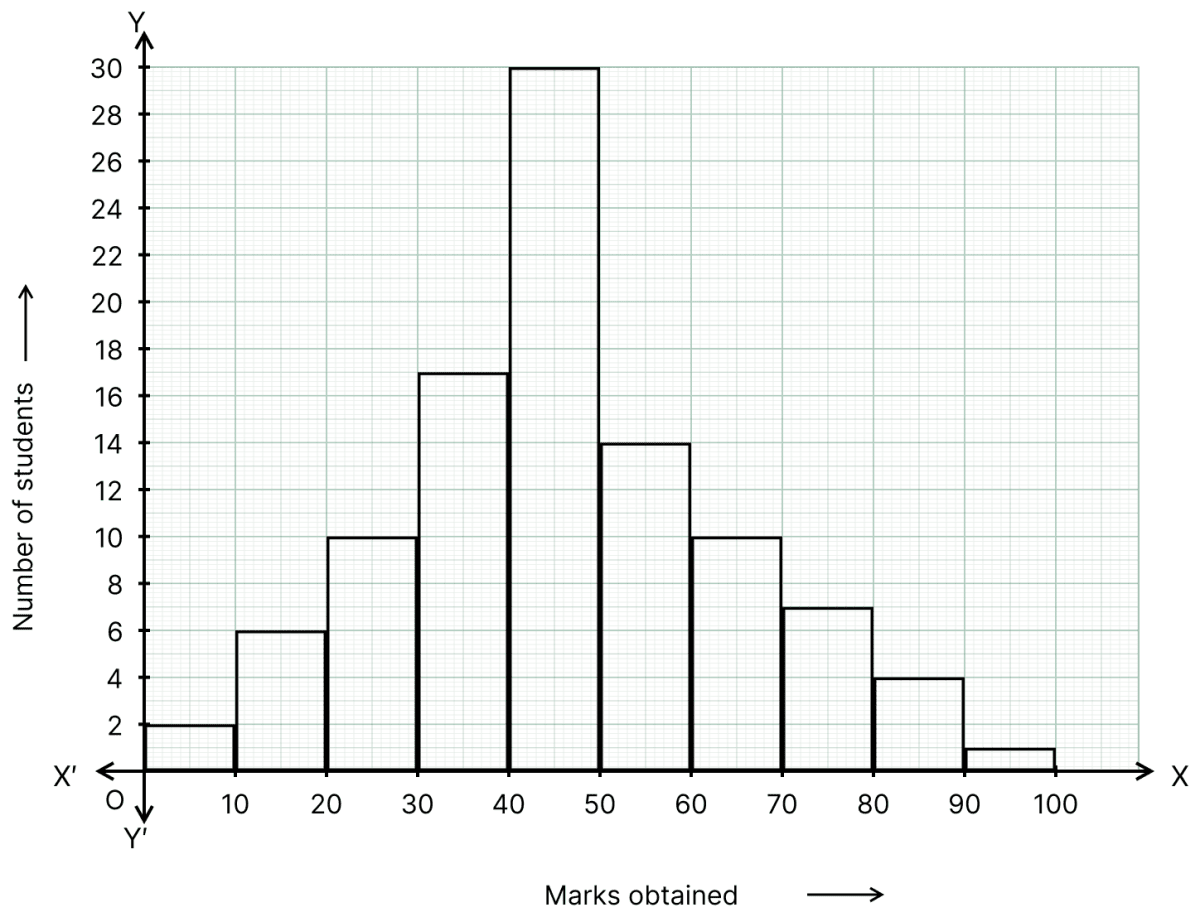
Draw a histogram of the following data :
Marks obtained by students in a Mathematics Paper of maximum marks 100.
| Marks obtained (Class interval) | Number of students (Frequency) |
|---|---|
| 0 - 10 | 2 |
| 10 - 20 | 6 |
| 20 - 30 | 10 |
| 30 - 40 | 17 |
| 40 - 50 | 30 |
| 50 - 60 | 14 |
| 60 - 70 | 10 |
| 70 - 80 | 7 |
| 80 - 90 | 4 |
| 90 - 100 | 1 |
Answer
Steps:
Take 1 cm on x-axis = 10 units (marks obtained).
Take 1 cm on y-axis = 2 students (frequency).
Construct rectangles corresponding to the given data. As the data is grouped, the rectangles are drawn adjacent to one another with no gap in between.
The required histogram is as given below:
The following data represents the number of students using different mode of transportation to come to school.
| Mode of transport | Number of students |
|---|---|
| Bicycle | 360 |
| School bus | 240 |
| Car | 80 |
| Walking | 120 |
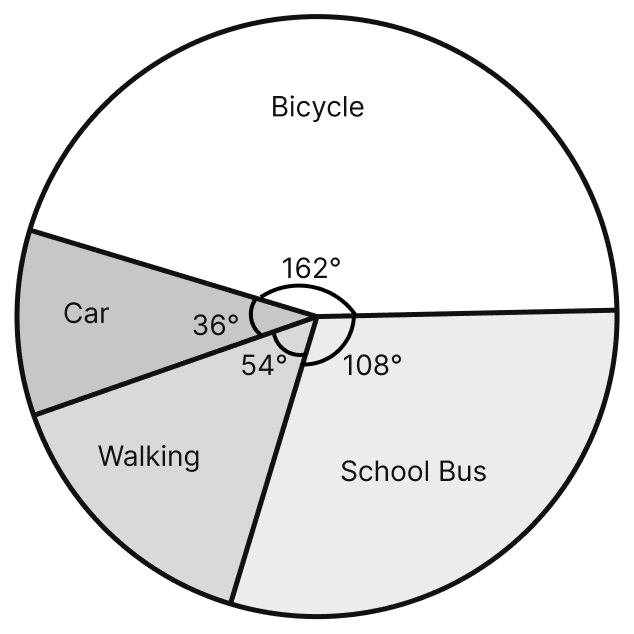
Draw a pie chart to represent this data.
Answer
To construct a pie chart, the angles for various sectors can be calculated as:
Total number of students = 360 + 240 + 80 + 120 = 800
| Mode of transport | Number of students | Angle |
|---|---|---|
| Bicycle | 360 | (360/800) × 360° = 162° |
| School bus | 240 | (240/800) × 360° = 108° |
| Car | 80 | (80/800) × 360° = 36° |
| Walking | 120 | (120/800) × 360° = 54° |
Steps:
Draw a circle of any radius.
Draw a horizontal radius of the circle.
The angle of sector for bicycle is 162°. Using protractor draw an angle of 162° on the horizontal radius.
Continue marking the remaining sectors moving in clockwise direction till all the sectors are marked.
Shade the sectors with different colours/designs and write the information in the sectors.
Thus the required pie chart is obtained.
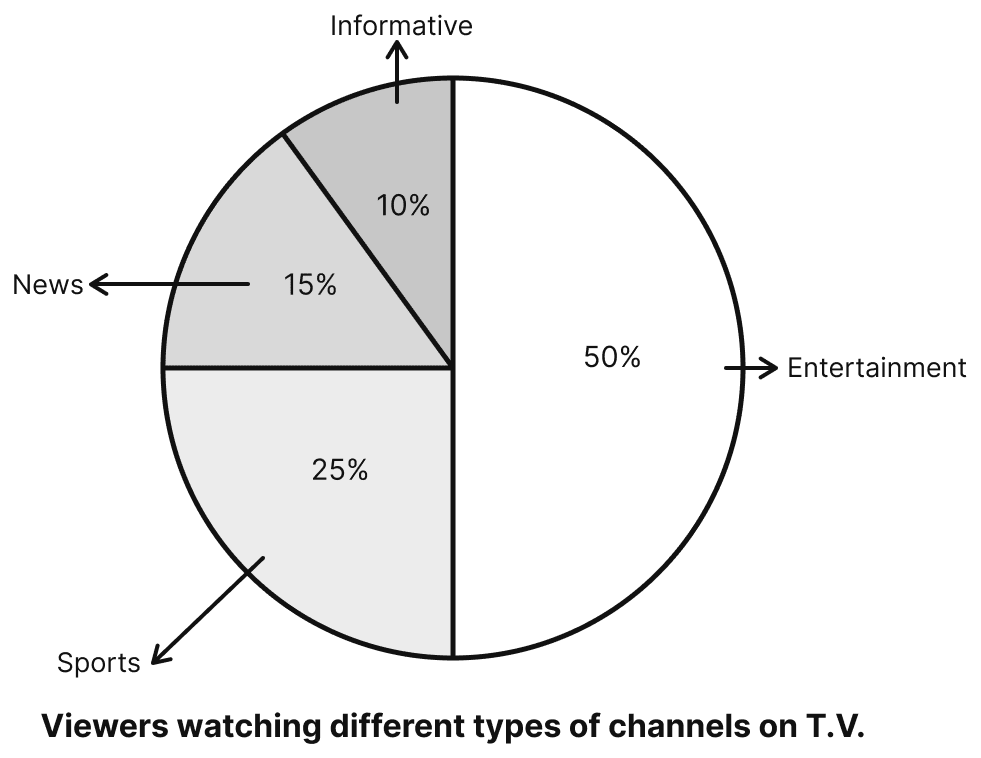
Answer the following questions based on the pie chart given below:
(i) Which type of programmes are viewed the most?
(ii) Which type of programmes are viewed the least?
(iii) Which two types of programmes have number of viewers equal to those watching sports channels?
Answer
To find the answers of the questions given above, we have to find the percentage of viewers watching the different types of channels.
From the pie chart, the percentages of viewers are:
| Type of programme | Percentage of viewers |
|---|---|
| Entertainment | 50% |
| Sports | 25% |
| News | 15% |
| Informative | 10% |
(i) The largest of these percentages is 50%, which corresponds to Entertainment.
Hence, entertainment programmes are viewed the most.
(ii) The smallest of these percentages is 10%, which corresponds to Informative.
Hence, informative programmes are viewed the least.
(iii) Percentage of viewers watching sports channels = 25%
Considering the remaining types of programmes two at a time,
Percentage of viewers watching news and informative programmes = 15% + 10% = 25%
Hence, news and informative programmes together have the number of viewers equal to those watching sports channels.
Suppose you spin the wheel shown in adjoining figure.
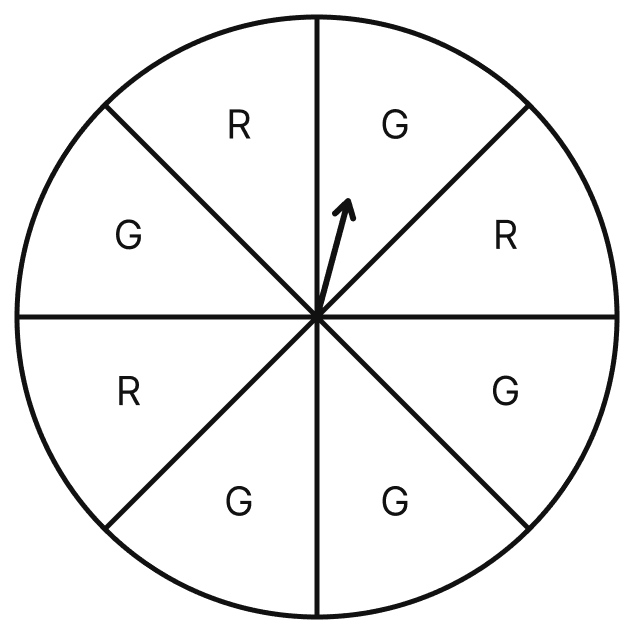
(i) List the outcomes of getting a green sector and not getting a green sector on this wheel.
(ii) Find the probability of getting a green sector.
(iii) Find the probability of not getting a green sector.
Answer
When the wheel shown in the figure is spun, the pointer may stop in any one of the 8 sectors, out of which 5 sectors are green (G) and 3 sectors are red (R). Hence, the possible outcomes are G, G, G, G, G, R, R, R.
∴ Total number of outcomes = 8
(i) The outcomes of getting a green sector are the outcomes marked G and the outcomes of not getting a green sector are the outcomes marked R.
Hence, the outcomes of getting a green sector are G, G, G, G, G and the outcomes of not getting a green sector are R, R, R.
(ii) The event is getting a green sector and the outcomes G, G, G, G, G are favourable to the event.
So, the number of favourable outcomes = 5
⇒ P(getting a green sector) =
=
Hence, the probability of getting a green sector is .
(iii) The event is not getting a green sector and the outcomes R, R, R are favourable to the event.
So, the number of favourable outcomes = 3
⇒ P(not getting a green sector) =
=
Hence, the probability of not getting a green sector is .
A bag has 4 red and 2 yellow balls. A ball is drawn from the bag without looking into the bag. What is the probability of getting
(i) a red ball?
(ii) not a red ball?
Answer
Total number of balls in the bag = 4 + 2 = 6
∴ Total number of outcomes = 6
(i) The event is getting a red ball.
The number of red balls in the bag is 4.
So, the number of favourable outcomes = 4
⇒ P(getting a red ball) =
=
=
Hence, the probability of getting a red ball is .
(ii) The event is not getting a red ball, that is getting a yellow ball.
The number of yellow balls in the bag is 2.
So, the number of favourable outcomes = 2
⇒ P(not getting a red ball) =
=
=
Hence, the probability of not getting a red ball is .
Three coins are tossed together, find the probability of getting
(i) atmost 2 heads
(ii) 3 heads.
Answer
When three coins are tossed together, the possible outcomes are HHH, HHT, HTH, HTT, TTT, TTH, THT and THH.
∴ Total number of outcomes = 8
(i) The event is getting atmost 2 heads, means getting no head or one head or two heads, and the outcomes HHT, HTH, HTT, TTT, TTH, THT, THH are favourable to the event.
So, the number of favourable outcomes = 7
⇒ P(getting atmost 2 heads) =
=
Hence, the probability of getting atmost 2 heads is .
(ii) The event is getting 3 heads and the outcome HHH is favourable to the event.
So, the number of favourable outcomes = 1
⇒ P(getting 3 heads) =
=
Hence, the probability of getting 3 heads is .
A letter is chosen from the word 'RECTANGLE'. What is the probability that it is
(i) a consonant
(ii) not a consonant.
Answer
In the word 'RECTANGLE' there are 9 letters R, E, C, T, A, N, G, L and E.
∴ Total number of outcomes = 9
Out of these 9 letters, there are three vowels E, A and E, so there are six consonants R, C, T, N, G and L.
(i) The event is getting a consonant and the letters R, C, T, N, G, L are favourable to the event.
So, the number of favourable outcomes = 6
⇒ P(getting a consonant) =
=
=
Hence, the probability that the letter chosen is a consonant is .
(ii) The event is not getting a consonant, that is getting a vowel, and the letters E, A, E are favourable to the event.
So, the number of favourable outcomes = 3
⇒ P(not getting a consonant) =
=
=
Hence, the probability that the letter chosen is not a consonant is .
A bag contains 12 balls out of which x are black.
(i) If a ball drawn at random, what is the probability that it will be a black ball?
(ii) If 6 more black balls are put in the bag, the probability of drawing a black ball will be double than that of (i). Find the value of x.
Answer
(i) Total number of balls in the bag = 12
∴ Total number of outcomes = 12
The event is getting a black ball.
The number of black balls in the bag is .
So, the number of favourable outcomes =
⇒ P(getting a black ball) =
=
Hence, the probability of getting a black ball is .
(ii) When 6 more black balls are put in the bag,
Total number of balls in the bag = 12 + 6 = 18
∴ Total number of outcomes = 18
The number of black balls in the bag = + 6
So, the number of favourable outcomes = + 6
⇒ P(getting a black ball) =
=
Given, this probability is double of that in part (i).
Hence, the value of x is 3.
Ankita and Nagma are friends. They were both born in 2010. What is the probability that they have
(i) same birthday?
(ii) different birthdays?
Answer
The year 2010 is not a leap year, so it has 365 days. Ankita's birthday is fixed on one of these 365 days and Nagma's birthday can be any one of these 365 days.
∴ Total number of outcomes = 365
(i) The event is that Nagma's birthday is the same as Ankita's birthday, which can happen on only one of the 365 days.
So, the number of favourable outcomes = 1
⇒ P(they have the same birthday) =
=
Hence, the probability that they have the same birthday is .
(ii) The event is that Nagma's birthday is different from Ankita's birthday, which can happen on any one of the remaining 365 - 1 = 364 days.
So, the number of favourable outcomes = 364
⇒ P(they have different birthdays) =
=
Hence, the probability that they have different birthdays is .