
Study the following frequency distribution table:
The table shows the pocket money (in ₹) per day of 50 students. Choose the correct answer from the given four options for questions 3 to 6:
| Class interval (Pocket money in ₹) | Frequency (No. of students) |
|---|---|
| 10-20 | 14 |
| 20-30 | 11 |
| 30-40 | 11 |
| 40-50 | 10 |
| 50-60 | 4 |
| Total | 50 |
Size of the class-intervals is
50
20
10
30
Answer
Class size = Upper limit - Lower limit
Taking the class 10-20,
⇒ Class size = 20 - 10
⇒ Class size = 10
Hence, option 3 is the correct option.
The class having the maximum frequency is
10-20
20-30
30-40
40-50
Answer
From the table, the frequencies are 14, 11, 11, 10 and 4.
The maximum of these frequencies is 14, which corresponds to the class 10-20.
Hence, option 1 is the correct option.
The upper limit of the class having minimum frequency is
30
40
50
60
Answer
From the table, the frequencies are 14, 11, 11, 10 and 4.
The minimum of these frequencies is 4, which corresponds to the class 50-60.
The upper limit of the class 50-60 is 60.
Hence, option 4 is the correct option.
The frequency of class whose class mark is 25 is
14
11
10
4
Answer
Class mark =
Taking the class 20-30,
⇒ Class mark =
⇒ Class mark =
⇒ Class mark = 25
The frequency of the class 20-30 is 11.
Hence, option 2 is the correct option.
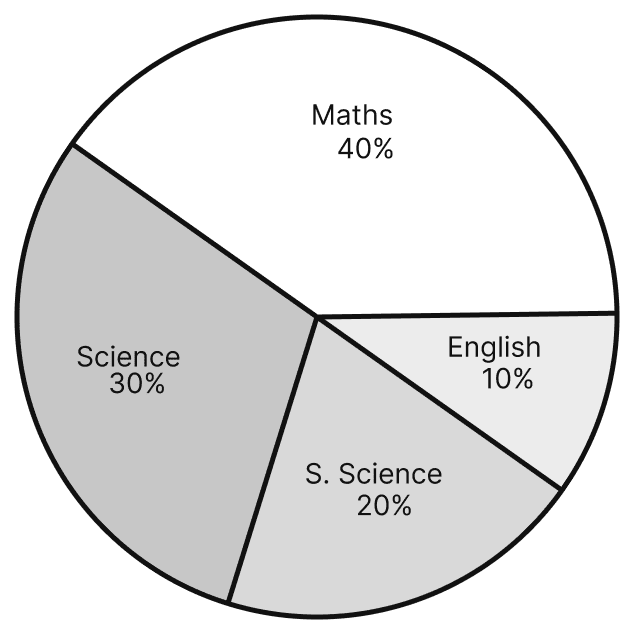
The pie graph shown in the adjoining figure represents different subjects liked by the students of class VIII. Study the pie graph carefully and choose the correct answer from the given four options for questions 7 to 10.
Which subject is liked by the maximum number of students
Maths
Science
S. Science
English
Answer
From the pie graph, the percentages of students liking the different subjects are:
| Subject | Percentage of students |
|---|---|
| Maths | 40% |
| Science | 30% |
| S. Science | 20% |
| English | 10% |
The maximum of these percentages is 40%, which corresponds to Maths.
Hence, option 1 is the correct option.
Which subject is liked by the minimum number of students
Maths
Science
S. Science
English
Answer
From the pie graph, the percentages of students liking the different subjects are:
| Subject | Percentage of students |
|---|---|
| Maths | 40% |
| Science | 30% |
| S. Science | 20% |
| English | 10% |
The minimum of these percentages is 10%, which corresponds to English.
Hence, option 4 is the correct option.
If there are 200 students in class VIII then number of students who like S. Science
10
20
40
80
Answer
From the pie graph, 20% of the students like S. Science and the total number of students is 200.
⇒ Number of students who like S. Science = × 200
⇒ Number of students who like S. Science = 40
Hence, option 3 is the correct option.
Number of students who like Science
20
40
60
80
Answer
From the pie graph, 30% of the students like Science and the total number of students is 200.
⇒ Number of students who like Science = × 200
⇒ Number of students who like Science = 60
Hence, option 3 is the correct option.
Probability of getting exactly 2 heads when three coins are tossed together
Answer
When three coins are tossed together, the possible outcomes are HHH, HHT, HTH, HTT, TTT, TTH, THT and THH.
∴ Total number of outcomes = 8
The event is getting exactly 2 heads and the outcomes HHT, HTH, THH are favourable to the event.
So, the number of favourable outcomes = 3
⇒ P(getting exactly 2 heads) =
=
Hence, option 3 is the correct option.
Probability of selecting a consonant from the letters of the word 'FATHER'
Answer
In the word 'FATHER' there are 6 letters F, A, T, H, E and R.
∴ Total number of outcomes = 6
Out of these 6 letters, there are two vowels A and E, so there are four consonants F, T, H and R.
So, the number of favourable outcomes = 4
⇒ P(selecting a consonant) =
=
=
Hence, option 4 is the correct option.
Probability of getting more than 2 heads when a pair of coins is tossed.
1
0
Answer
When a pair of coins is tossed, the possible outcomes are HH, HT, TH and TT.
∴ Total number of outcomes = 4
As only two coins are tossed, the number of heads cannot be more than 2 and so no outcome is favourable to the event.
So, the number of favourable outcomes = 0
⇒ P(getting more than 2 heads) =
=
= 0
Thus, getting more than 2 heads is an impossible event and the probability of an impossible event is 0.
Hence, option 4 is the correct option.
Probability of getting a red ball from a bag containing 20 red balls
0
1
Answer
Total number of balls in the bag = 20
∴ Total number of outcomes = 20
The event is getting a red ball.
As all the 20 balls in the bag are red, every outcome is favourable to the event.
So, the number of favourable outcomes = 20
⇒ P(getting a red ball) =
=
= 1
Thus, getting a red ball is a sure event and the probability of a sure event is 1.
Hence, option 2 is the correct option.
Probability of getting a non red ball from a bag containing 4 red, 5 blue and 3 black balls is
Answer
Total number of balls in the bag = 4 + 5 + 3 = 12
∴ Total number of outcomes = 12
The event is getting a non red ball.
The number of non red balls in the bag = 5 + 3 = 8
So, the number of favourable outcomes = 8
⇒ P(getting a non red ball) =
=
=
Hence, option 2 is the correct option.