
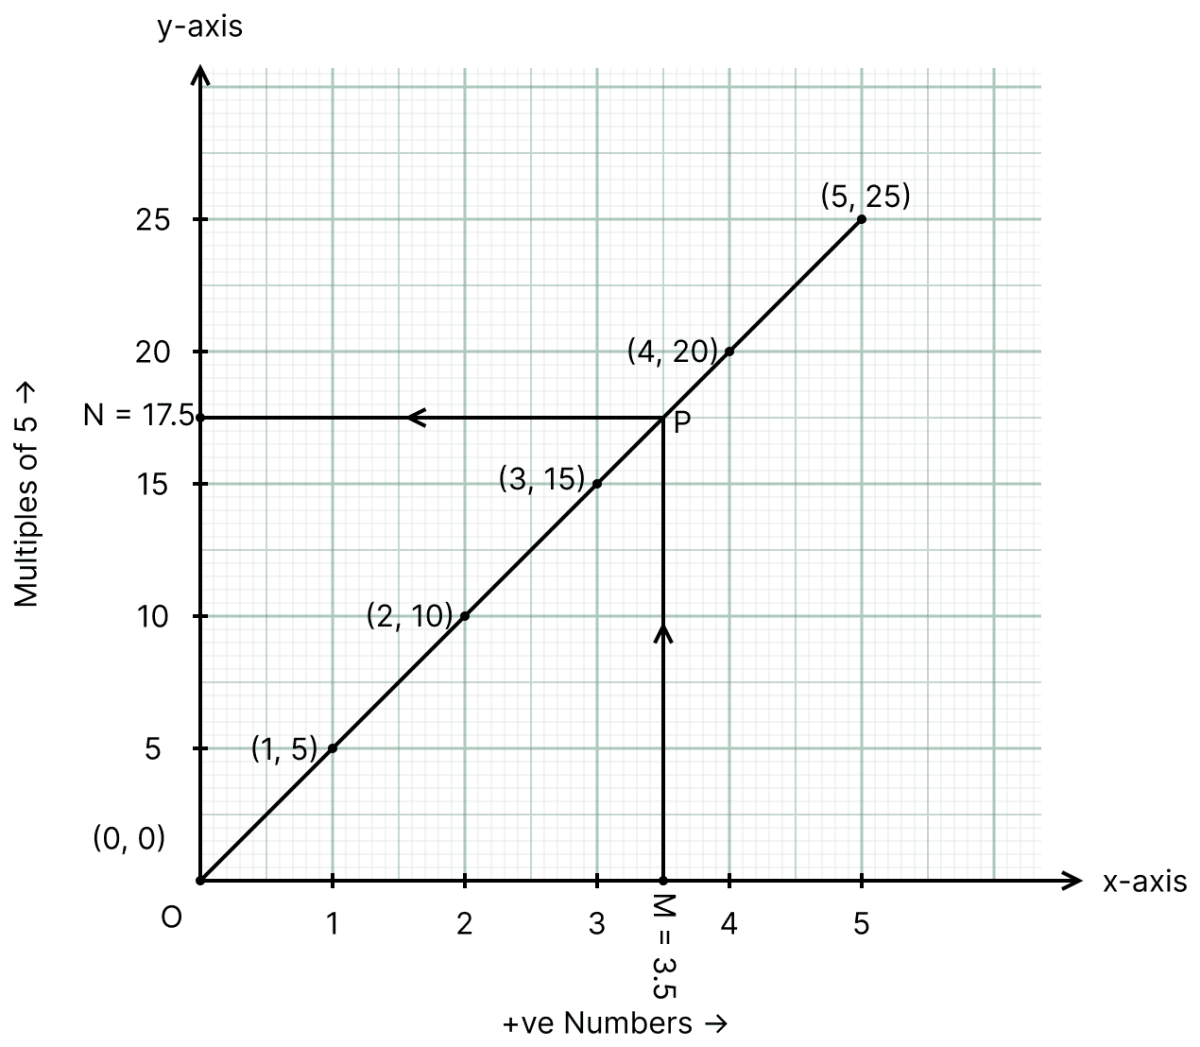
Draw a graph to represent the rule of multiplication by 5 of all positive numbers including 0. From the graph, find the product of 5 and 3.5.
Answer
The rule of multiplication by 5 is given by the relation y = 5x, where x represents the positive numbers 0, 1, 2, 3, ... including 0, and y represents their corresponding multiples of 5.
The table of values is given below:
| x | y = 5x |
|---|---|
| 0 | 0 |
| 1 | 5 |
| 2 | 10 |
| 3 | 15 |
| 4 | 20 |
| ... | ... |
Represent the numbers 0, 1, 2, 3, ... on the x-axis and their respective multiples of 5 on the y-axis.
Scale: Take,
1 unit on x-axis = 1 (number),
1 unit on y-axis = 5 (number).
Plot the points (0, 0), (1, 5), (2, 10), (3, 15), (4, 20), ... on the graph paper and join these points.
To find the product of 5 and 3.5 :
Corresponding to the number 3.5, locate a point M on the x-axis and draw a vertical line through M to meet the graph at P.
From P, draw a horizontal line to meet the y-axis at the point N.
The point N represents 17.5.
Hence, the product of 5 and 3.5 is 17.5.
The following table gives the quantity of rice and its cost.
| No. of kg of rice | Cost of rice (in ₹) |
|---|---|
| 1 | 30 |
| 2 | 60 |
| 3 | 90 |
| 5 | 150 |
Plot a graph to show the above data. Use this graph to find
(i) the amount needed to buy 4 kg rice.
(ii) the quantity of rice that can be purchased for ₹ 105.
Answer
Represent the quantity of rice (in kg) along the x-axis and its cost (in ₹) along the y-axis.
Scale: Take,
1 unit on x-axis = 1 kg,
1 unit on y-axis = ₹ 30.
Plot the points (1, 30), (2, 60), (3, 90) and (5, 150) on the graph paper and join these points.
We note that the graph so obtained is a linear graph.
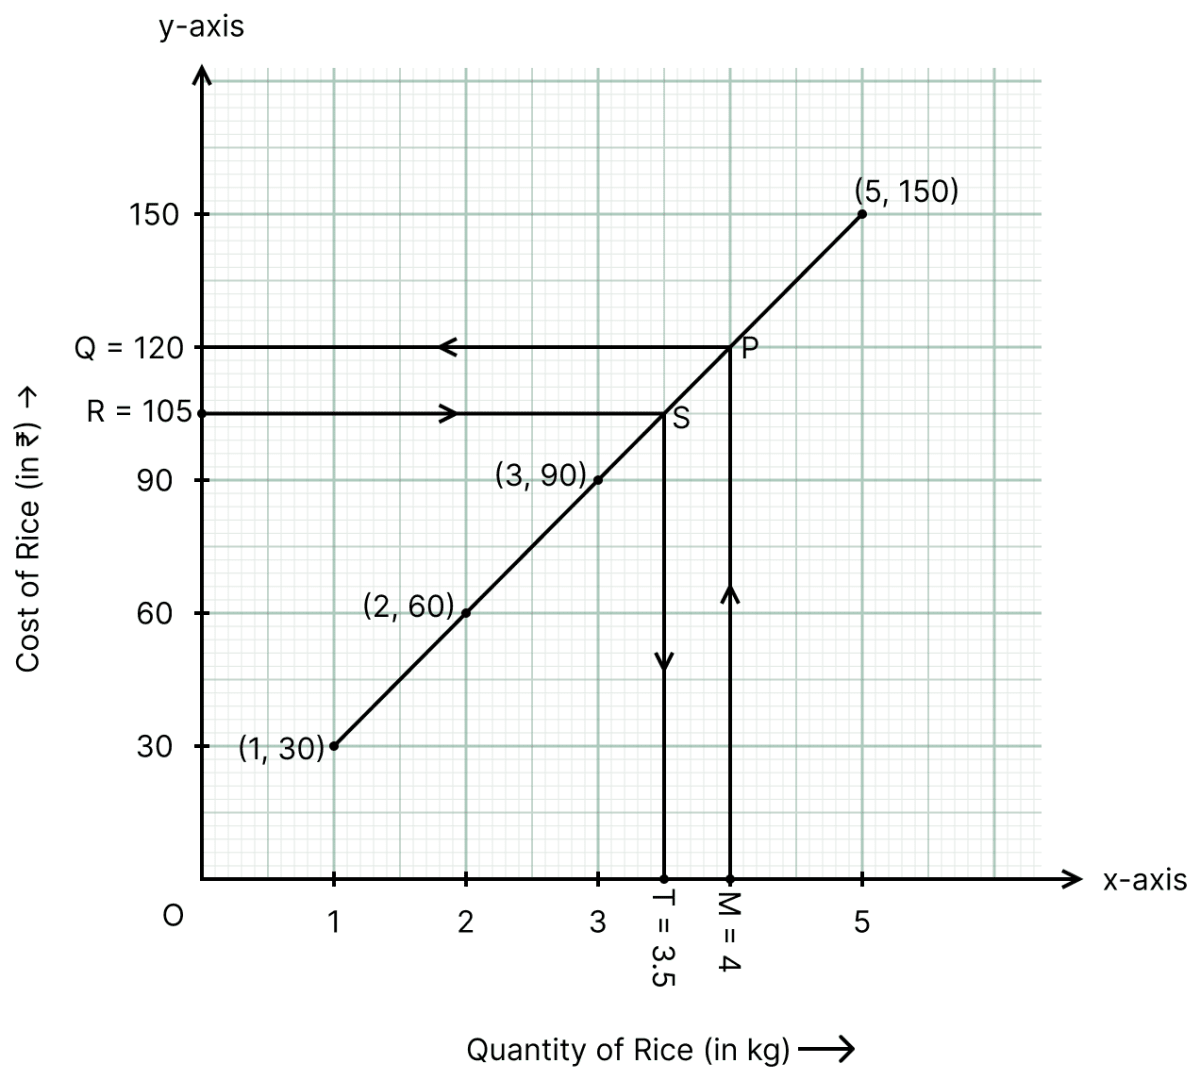
(i) Corresponding to 4 kg of rice, locate a point M on the x-axis and draw a vertical line through M to meet the graph at P.
From P, draw a horizontal line to meet the y-axis at the point Q.
The point Q represents 120.
Hence, the amount needed to buy 4 kg rice is ₹ 120.
(ii) Corresponding to ₹ 105, locate a point R on the y-axis and draw a horizontal line through R to meet the graph at S.
From S, draw a vertical line to meet the x-axis at the point T.
The point T represents 3.5.
Hence, the quantity of rice that can be purchased for ₹ 105 is 3.5 kg.
The following table shows the interest on deposits for a year:
| Deposits (in ₹) | Simple interest (in ₹) |
|---|---|
| 1,000 | 60 |
| 1,500 | 90 |
| 2,000 | 120 |
| 2,400 | 144 |
| 2,700 | 162 |
| 3,000 | 180 |
Plot a graph to show the above data. Use this graph to answer the following questions:
(i) Simple interest on ₹ 1,800 for one year.
(ii) How much money should be deposited to get an interest of ₹ 156?
Answer
Represent the deposits (in ₹) along the x-axis and the simple interest (in ₹) along the y-axis.
Scale: Take,
1 unit on x-axis = ₹ 500,
1 unit on y-axis = ₹ 30.
Plot the points (1000, 60), (1500, 90), (2000, 120), (2400, 144), (2700, 162) and (3000, 180) on the graph paper and join these points.
We note that the graph so obtained is a linear graph.
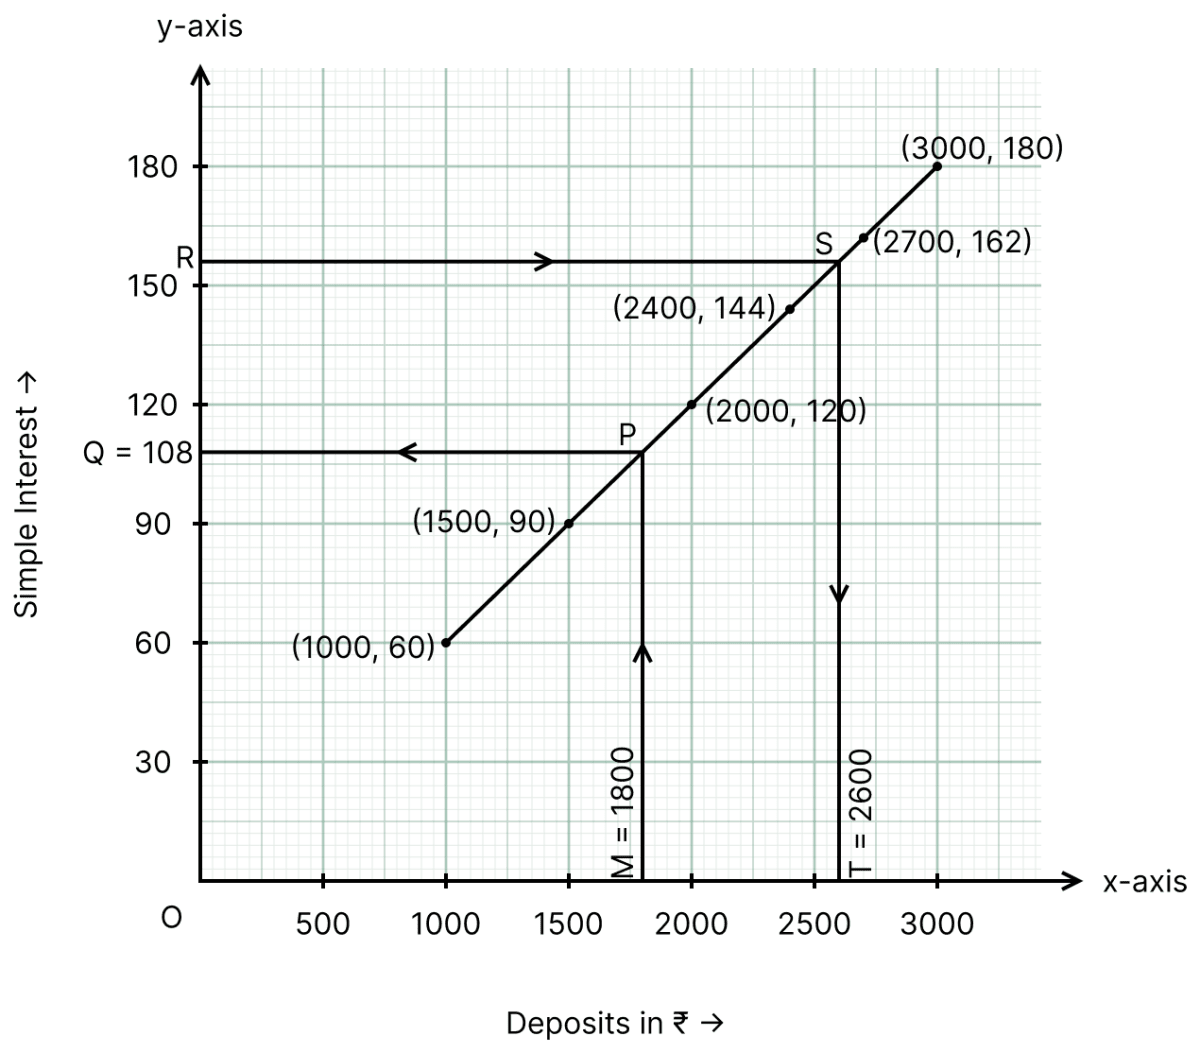
(i) Corresponding to the deposit of ₹ 1,800, locate a point M on the x-axis and draw a vertical line through M to meet the graph at P.
From P, draw a horizontal line to meet the y-axis at the point Q.
The point Q represents 108.
Hence, the simple interest on ₹ 1,800 for one year is ₹ 108.
(ii) Corresponding to the interest of ₹ 156, locate a point R on the y-axis and draw a horizontal line through R to meet the graph at S.
From S, draw a vertical line to meet the x-axis at the point T.
The point T represents 2600.
Hence, ₹ 2,600 should be deposited to get an interest of ₹ 156.
The following table gives the temperature in °C and its corresponding value in °F.
| Temperature in °C | Temperature in °F |
|---|---|
| 0 | 32 |
| 5 | 41 |
| 10 | 50 |
| 15 | 59 |
| 20 | 68 |
| 30 | 86 |
| 40 | 104 |
Draw a graph by taking temperature in °C on x-axis and in °F on y-axis.
Use this graph to answer the following questions:
(i) What is the temperature in °F corresponding to 25°C?
(ii) What is the temperature in °C corresponding to 95°F?
Answer
Represent the temperature in °C along the x-axis and the temperature in °F along the y-axis.
Scale: Take,
1 unit on x-axis = 5°C,
1 unit on y-axis = 10°F.
Plot the points (0, 32), (5, 41), (10, 50), (15, 59), (20, 68), (30, 86) and (40, 104) on the graph paper and join these points.
We note that the graph so obtained is a linear graph.
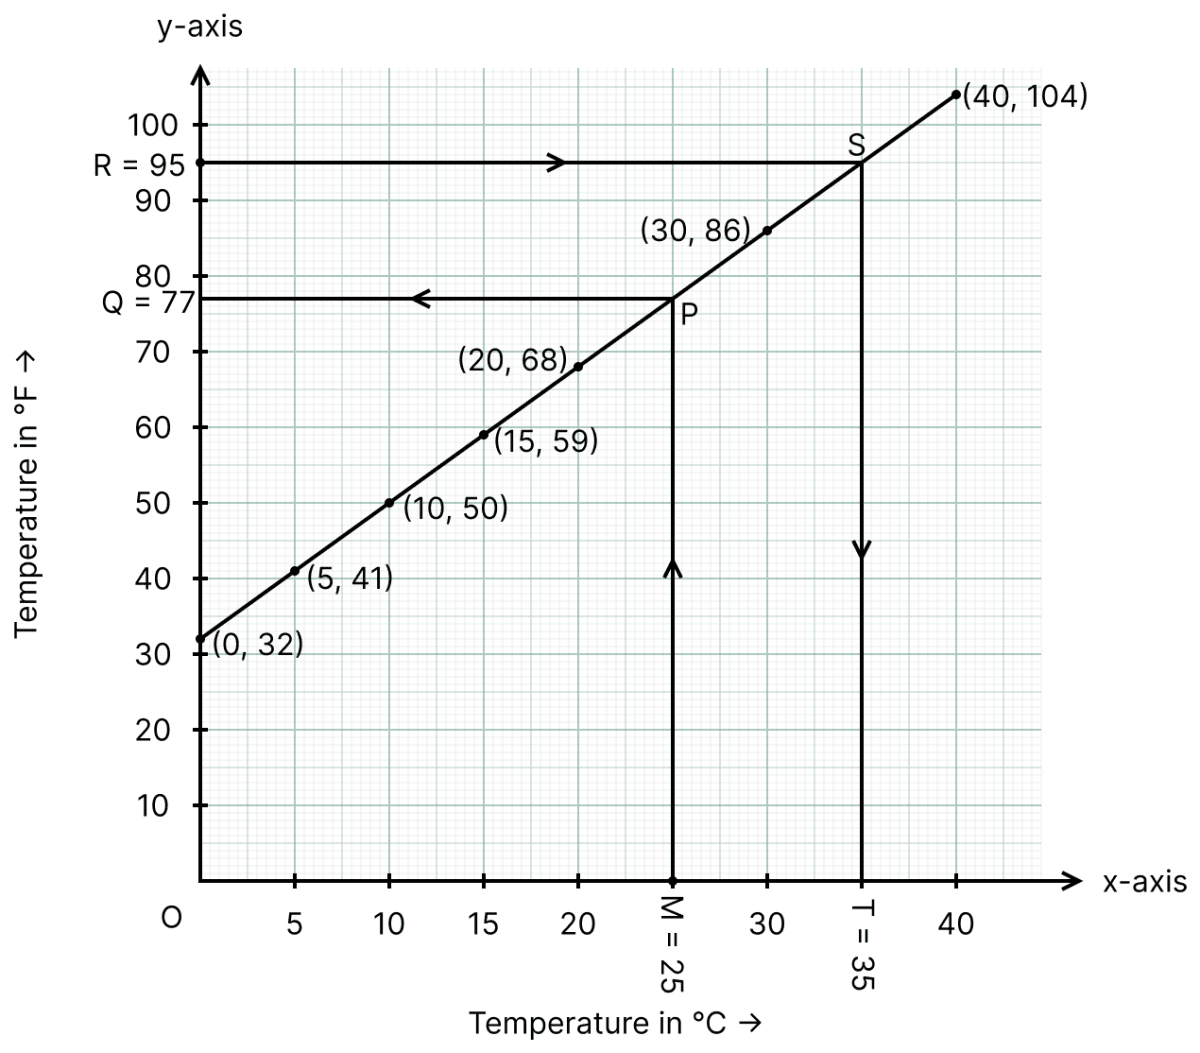
(i) Corresponding to 25°C, locate a point M on the x-axis and draw a vertical line through M to meet the graph at P.
From P, draw a horizontal line to meet the y-axis at the point Q.
The point Q represents 77.
Hence, the temperature in °F corresponding to 25°C is 77°F.
(ii) Corresponding to 95°F, locate a point R on the y-axis and draw a horizontal line through R to meet the graph at S.
From S, draw a vertical line to meet the x-axis at the point T.
The point T represents 35.
Hence, the temperature in °C corresponding to 95°F is 35°C.
The given graph shows the temperature recorded on a day at different times. Study the graph and answer the following questions:
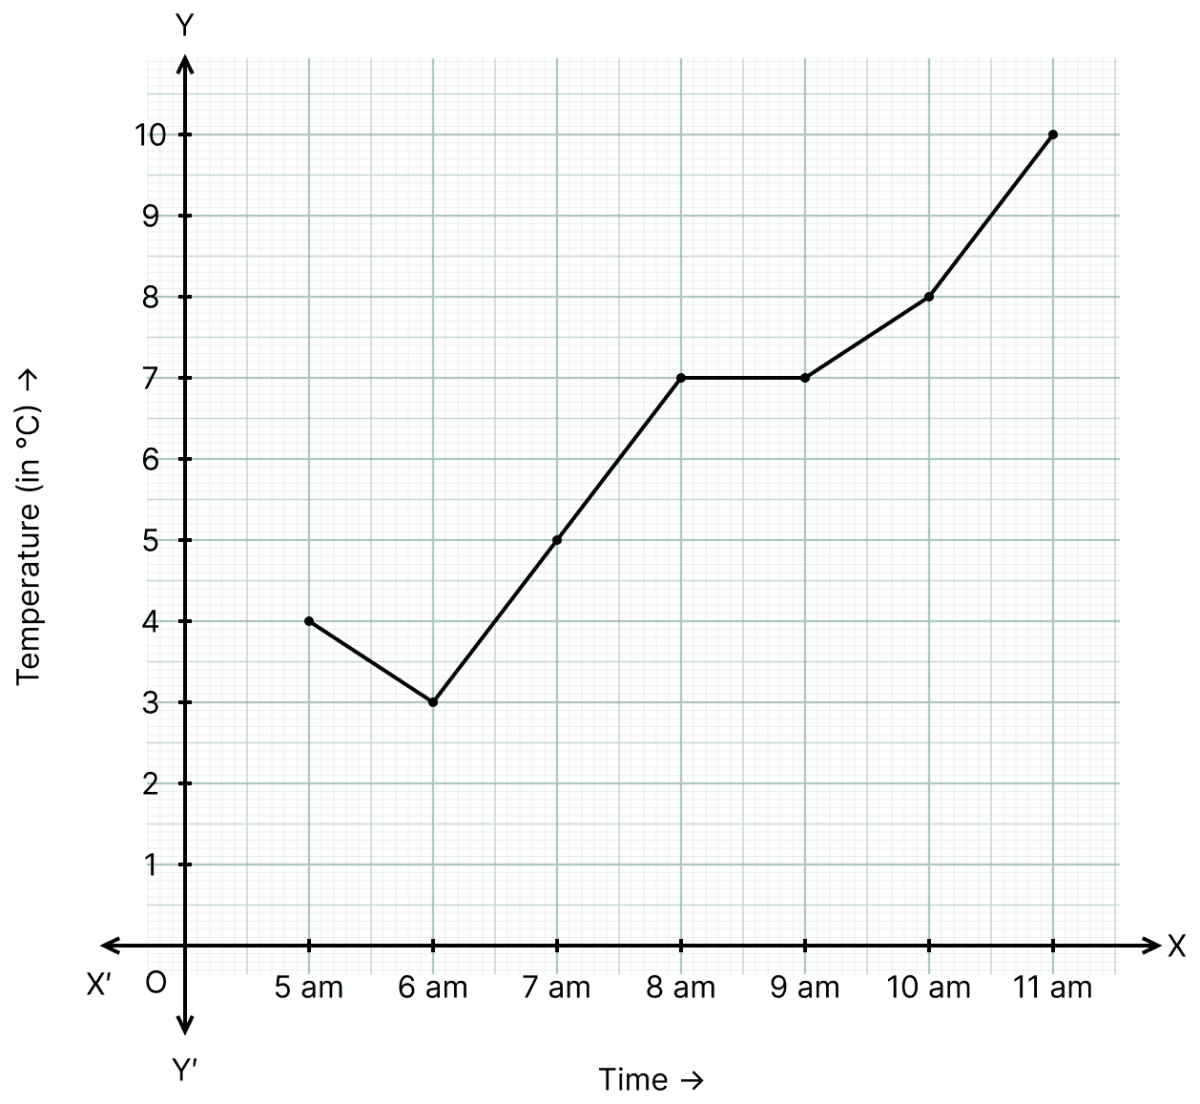
(i) What is the temperature at 6 a.m.?
(ii) At what time is the temperature 10 °C?
(iii) During which hour was there a constant temperature?
(iv) During which hour did the temperature fall?
(v) What is the change in temperature between 8 a.m. to 11 a.m.?
Answer
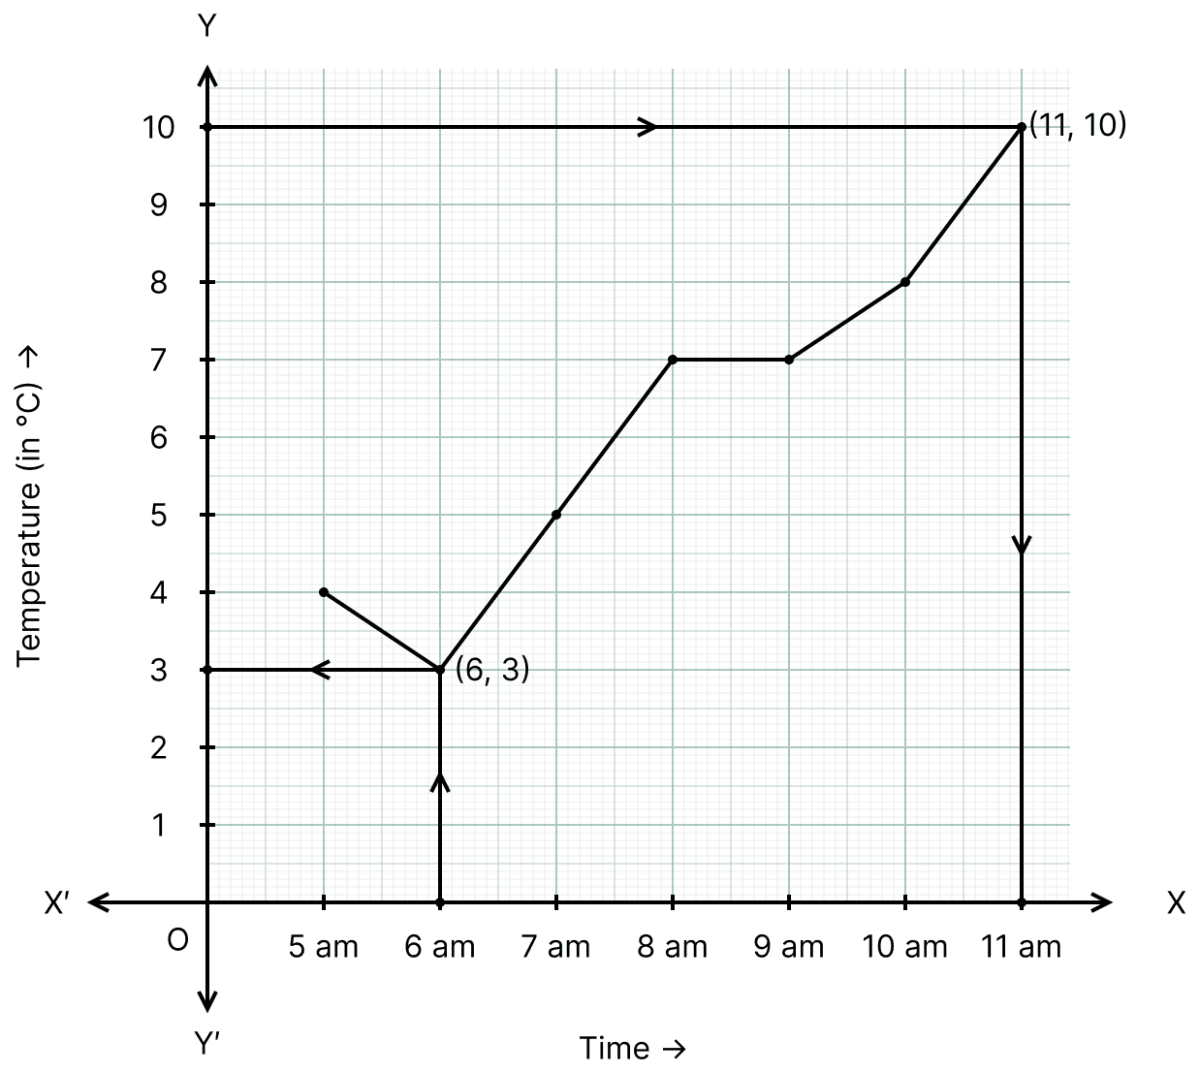
(i) Corresponding to 6 a.m. on the x-axis, draw a vertical line to meet the graph at a point.
From this point, draw a horizontal line to meet the y-axis. It meets the y-axis at 3.
Hence, the temperature at 6 a.m. is 3°C.
(ii) Corresponding to 10 °C on the y-axis, draw a horizontal line to meet the graph at a point.
From this point, draw a vertical line to meet the x-axis. It meets the x-axis at 11 a.m.
Hence, the temperature is 10 °C at 11 a.m.
(iii) The temperature remains constant during the hour in which the graph is a horizontal line segment.
From the graph, the temperature is 7 °C at 8 a.m. and it is 7 °C at 9 a.m. also.
Hence, there was a constant temperature between 8 a.m. and 9 a.m.
(iv) The temperature falls during the hour in which the graph slopes downwards.
From the graph, the temperature is 4 °C at 5 a.m. and it falls to 3 °C at 6 a.m.
Hence, the temperature fell between 5 a.m. and 6 a.m.
(v) From the graph,
Temperature at 8 a.m. = 7 °C
Temperature at 11 a.m. = 10 °C
Change in temperature = 10 °C - 7 °C = 3 °C
Hence, the change in temperature between 8 a.m. to 11 a.m. is a rise of 3 °C.