
What are the factors that influence the demand for and supply of goods and services in a market?
Answer
The demand for and supply of goods and services in a market are influenced by several factors:
Factors influencing Demand
- Price of the good or service – According to the Law of Demand, when price rises, quantity demanded generally falls, and when price falls, quantity demanded rises.
- Price of related goods – Changes in the prices of substitute goods and complementary goods affect demand.
- Income of consumers – A rise in income generally increases consumers’ ability to buy more or better-quality goods.
- Taste and preferences – Consumers’ choices and preferences influence the demand for particular products.
- Size and composition of population – The number and age composition of people affect the demand for different goods and services.
- Seasonality – Weather, festivals and cultural habits influence demand at different times of the year.
- Future price expectations – If consumers expect prices to rise, present demand may increase; if they expect prices to fall, they may postpone purchases.
Factors influencing Supply
- Price of the good or service – According to the Law of Supply, higher prices generally encourage producers to supply more, while lower prices reduce supply.
- Price of related goods – Producers may shift production towards goods that are more profitable.
- Number of sellers in the market – More sellers increase market supply, while fewer sellers reduce it.
- Technology – Better technology can reduce the cost of production and increase supply.
- Future expectations – Producers may increase or reduce production depending on their expectations about future demand and prices.
- Other factors – Changes in input costs, availability of resources, weather and disasters can also affect supply.
How are prices of goods and services determined through demand and supply interactions?
Answer
Prices are determined by the interaction between demand and supply in the market.
- Buyers are willing to buy different quantities at different prices, while sellers are willing to supply different quantities at different prices.
- According to the Law of Demand, quantity demanded generally rises when price falls and falls when price rises.
- According to the Law of Supply, quantity supplied generally rises when price rises and falls when price falls.
- When demand is greater than supply, there is excess demand or shortage, which tends to push prices upward.
- When supply is greater than demand, there is excess supply or surplus, which tends to push prices downward.
- The market tends towards an equilibrium price at which quantity demanded equals quantity supplied.
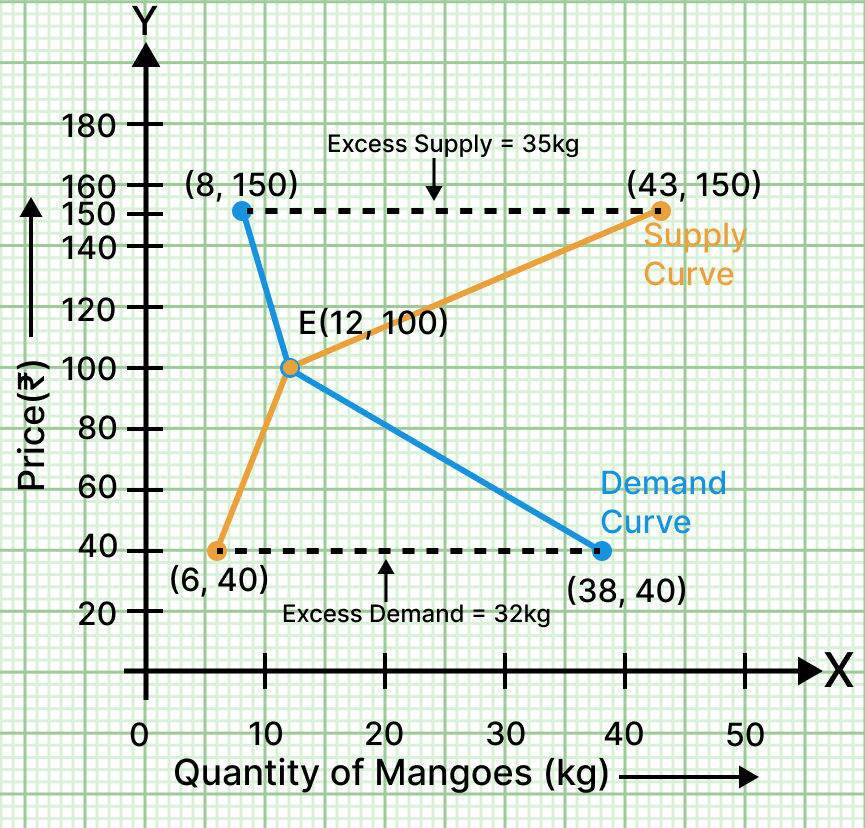
For example, in the mango market, at ₹40 per kg, buyers demand 38 kg while sellers supply only 6 kg, creating excess demand. At ₹150 per kg, sellers supply 43 kg while buyers demand only 8 kg, creating excess supply. At ₹100 per kg, quantity demanded and quantity supplied are both 12 kg. Therefore, ₹100 is the equilibrium price.
What is market equilibrium, and does it exist in the real world?
Answer
Market equilibrium is the point where the quantity demanded equals the quantity supplied. At this point, there is neither excess demand nor excess supply, and there is no immediate pressure for the price to change.
- At the equilibrium price, quantity demanded equals quantity supplied and the market is said to be ‘cleared’.
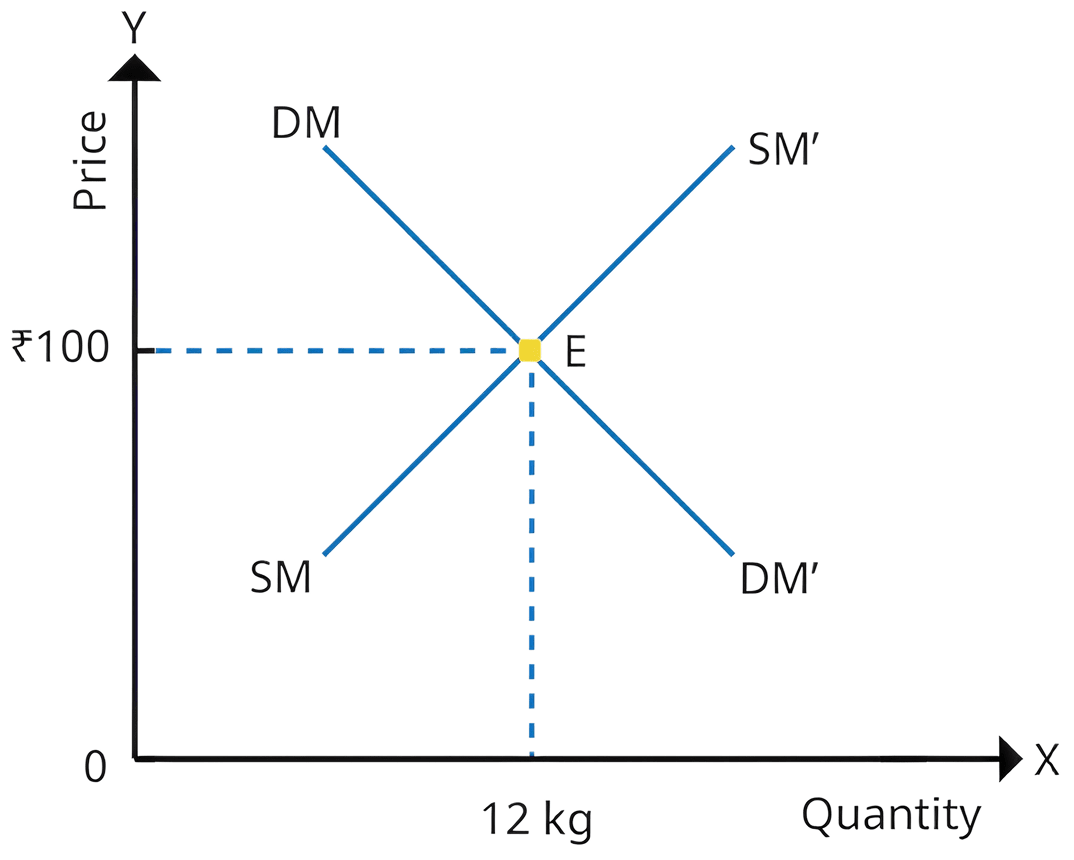
- In the mango market, at ₹100 per kg, quantity demanded and quantity supplied are both 12 kg. Therefore, the equilibrium price is ₹100 and the equilibrium quantity is 12 kg.
- Graphically, equilibrium is represented by point E, where the demand curve intersects the supply curve.
Market equilibrium exist in the real world
In the real world, markets are dynamic with constantly changing conditions.
- Changes in technology, wages, interest rates, political events, pandemics, weather and natural disasters can alter demand and supply.
- Therefore, equilibrium is not permanently stable. Markets are constantly adjusting towards a new equilibrium as conditions change.
- For example, during the COVID-19 pandemic in 2020, demand for face masks rose sharply. Supply could not immediately match the increased demand, so prices rose. Over time, producers increased supply and prices fell. When demand later declined, prices fell further.
Thus, market equilibrium exists as a useful economic concept, but in real markets it keeps shifting as demand and supply change.
How and why does the government intervene in the market?
Answer
In a market economy, prices mainly depend on demand and supply. However, markets do not always ensure fair access to essential goods and services. Therefore, the government may intervene to protect public welfare.
Regulation of unfair practices
- The government may set price ceilings on essential goods such as medicines to prevent overcharging.
- It may set minimum wages to protect workers from unduly low wages. A minimum wage acts as a price floor for labour.
- If one or a few sellers dominate a market, they may restrict supply or charge high prices. The government regulates such practices to protect consumers.
- Regulators such as the RBI, CCPA, TRAI and SEBI help ensure fairness and transparency in different sectors.
- During the COVID-19 pandemic, the government regulated the price of hand sanitisers to prevent overcharging, hoarding and black-marketing.
Provision of public goods
- The government provides or funds public goods and services such as roads, bridges, public parks, streetlights, sanitation, drainage and national defence.
- Private firms may not provide enough of these goods because they may not generate sufficient direct profit.
- Government provision helps ensure social welfare, economic development and wider access.
However, government intervention must be carefully designed because excessive regulation can create price distortions, reduce producer incentives, increase compliance burdens and discourage innovation.
In the chapter ‘Democracy’, you have read that a democratic government is accountable to the people and is expected to act in their interest.
(a) According to you, how should a democratic government decide when and how much it should intervene in markets to protect people's welfare?
(b) Whose voices should a democratic government consider while making such decisions—consumers, producers, workers, or others? Why?
Answer
(a) A democratic government should intervene in markets when necessary to protect public welfare, while avoiding unnecessary interference.
- Protect consumers: It should act when essential goods become unaffordable or when there is hoarding, black-marketing, overcharging or harmful monopoly behaviour.
- Provide public goods: It should provide or fund services such as roads, street lighting, sanitation and defence when markets do not provide them adequately.
- Avoid excessive intervention: Regulation should be carefully designed because excessive intervention can distort prices, reduce incentives for production and innovation, and increase compliance costs.
- Review emergency measures: Temporary measures such as price controls should be reviewed regularly and withdrawn when no longer necessary.
- Ensure accountability: Decisions should be transparent and based on evidence about their effects on prices, supply and public welfare.
(b)
A democratic government should consider the views of all groups affected by its decisions.
- Consumers – Essential goods and services should remain affordable and accessible.
- Producers and sellers – Their costs and ability to earn a reasonable return should be considered because excessive price controls may reduce supply.
- Workers – Their wages and working conditions should be considered.
- Small businesses and entrepreneurs – Their concerns about regulations, licences and compliance costs should be considered.
- Farmers, experts and future generations – Their views are important for agricultural needs, economic effects and long-term sustainability.
Thus, government decisions should balance consumer welfare, producer and worker interests, economic efficiency and long-term public welfare.
Using data from Table 9.3, plot the demand and supply curve at the three prices, i.e., ₹40, ₹100, and ₹150. Identify and mark excess demand and supply on the graph. Think about how equilibrium could be reached in these scenarios.
Answer
Using the data from Table 9.3, the graph is plotted with:
Quantity of mangoes (kg) on X-axis and Price (₹) on Y-axis.
How equilibrium is reached
- When the price is ₹40, there is excess demand. Buyers want more than sellers are supplying, so the price tends to rise.
- When the price is ₹150, there is excess supply. Sellers are supplying more than buyers want, so the price tends to fall.
- The market moves toward ₹100, where quantity demanded becomes equal to quantity supplied.
Hence, market equilibrium is reached at ₹100 and 12 kg, where there is neither shortage nor surplus.
Create your own demand schedule for buying notebooks at different prices. At what price would you buy the most? At what price would you stop buying altogether? What could be the reason behind your choices?
Answer
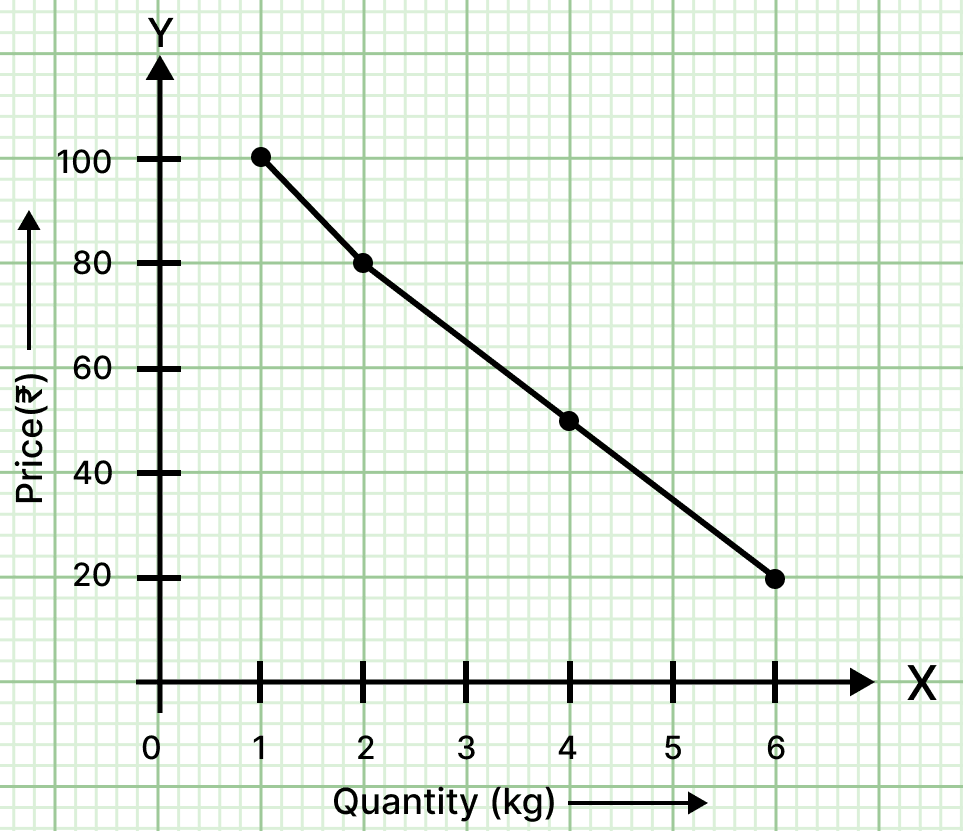
A possible demand schedule for notebooks is:
| Price per notebook | Quantity demanded |
|---|---|
| ₹100 | 0 |
| ₹80 | 1 |
| ₹60 | 2 |
| ₹40 | 4 |
| ₹20 | 6 |
- I would buy the most notebooks at ₹20, because the price is low and I can afford a larger quantity.
- I would stop buying at ₹100, as the price is too high for my purchasing power.
- This illustrates the Law of Demand: when the price of a product falls, its quantity demanded generally increases, and when the price rises, its quantity demanded decreases, other factors remaining constant.
Ask your family members if they postponed or advanced buying any product because of future expectations of changes in price?
Answer
Yes. My family once postponed buying a refrigerator before Diwali because they expected its price to fall during the festival sale. When discounts were announced, they purchased it at a lower price.
This shows that future price expectations influence present demand. If consumers expect prices to fall, they may postpone purchases, while if they expect prices to rise, they may buy earlier.
What happens to the supply of a product in case of a change in the cost of inputs, discovery of an alternate input, depletion of resources, change in weather, disaster, etc.? Discuss in class using examples of diverse goods and services.
Answer
The supply of a product changes in the following ways:
- Change in the cost of inputs – A rise in the cost of inputs such as seeds, fertilisers, fuel or wages increases production costs and may reduce supply. A fall in input costs may increase supply. For example, higher diesel prices raise transport costs and may reduce the supply of vegetables.
- Discovery of an alternative input – A cheaper or more efficient input can reduce production costs and increase supply. For example, improved irrigation methods can increase crop production and supply.
- Depletion of resources – Scarcity of raw materials or natural resources can reduce supply. For example, overfishing can reduce the supply of fish.
- Change in weather – Favourable weather can increase agricultural supply, while droughts or unseasonal rainfall can reduce it. For example, a good monsoon can increase the supply of crops.
- Disaster – Floods, earthquakes and other disasters can damage crops, factories and transport networks, reducing supply and often causing prices to rise.
Thus, factors that lower production costs or improve production conditions tend to increase supply, while factors that raise costs or reduce resource availability tend to decrease supply.
From your surroundings, list two goods or services that are provided by the government (for example: roads, streetlights, parks, police, and so on.). Choose one of the goods you listed and answer:
a. Who does benefit from it?
b. Why would it be difficult for a private company to provide this service on its own?
c. Imagine the government stops providing this good or service, what problems might people in your area face?
Answer
Two goods or services provided by the government in my surroundings are roads and streetlights. I have chosen streetlights.
a. Streetlights benefit all people in the locality, including pedestrians, cyclists, drivers, shopkeepers and residents travelling after dark.
b. It is difficult for a private company to provide streetlights independently because it is difficult to charge each user separately. Many people may benefit without paying, making it difficult to recover the cost. Therefore, government provision or funding is generally required.
c. Without streetlights, roads would remain dark at night, increasing the risk of accidents and reducing safety. Shops and other activities may also close earlier, affecting daily life and economic activity.
Can you think of another real-life example (other than hotels) where prices change frequently? Explain why the prices keep changing.
Answer
A common real-life example is airline ticket prices. The price of the same flight seat may change frequently depending on demand and availability.
- During holidays or festivals, demand rises and ticket prices generally increase.
- When demand is low or many seats are still available, airlines may reduce prices to attract passengers.
- Prices may also change depending on the number of seats left, the number of days before departure, the season and expected future demand.
Thus, airline fares show that markets are dynamic and prices keep adjusting according to changes in demand and supply.
Our choices today affect future resources. For example, high demand for fast fashion, overfishing and overuse of groundwater can harm future supply. So, should we focus only on short-term gains, or also think about long-term sustainability? How could this affect the market equilibrium?
Answer
Long-term sustainability should be considered along with short-term gains because present choices affect the future availability of resources.
- High demand for fast fashion, overfishing and excessive use of groundwater can deplete natural resources and reduce future supply.
- If resources become scarce, supply may fall while demand remains high.
- This may push prices upward and move the market towards a new equilibrium with a higher price and possibly a lower quantity.
- Sustainable use of resources can help protect future supply and support more stable market conditions.
Have you ever seen or heard of the government fixing prices or wages (for example, bus fares, medicines, or minimum wages)? Share an example and why you think it was done.
Answer
During the COVID-19 pandemic, demand for hand sanitisers increased sharply. Shortages, hoarding and overpricing were reported, so the government fixed a maximum retail price for hand sanitisers.
This was done to prevent overcharging, discourage hoarding and ensure the availability of an essential product at a reasonable price.
Other examples include price ceilings on certain essential medicines and minimum wages for workers. A price ceiling limits the maximum price that can be charged, while a minimum wage sets a legal lower limit on wages.
An increase in income always leads to a rise in demand for goods. Defend or refute, giving reasons for the same.
Answer
The statement should be refuted.
An increase in income does not always lead to a rise in demand for every good.
- A rise in household income generally increases purchasing power, so consumers may buy more goods or choose higher-quality products.
- However, demand also depends on taste and preferences, prices of related goods, seasonality, future price expectations and population composition.
- Therefore, the demand for a particular good may not rise even if income increases.
If petrol prices double, what happens to
a. Demand for diesel cars
b. Demand for electric cars
c. Demand for car accessories
d. Demand for public transport
Answer
a. Demand for diesel cars – It is likely to increase because diesel cars can act as substitutes for petrol cars.
b. Demand for electric cars – It is likely to increase because electric cars are also substitutes for petrol cars and do not use petrol.
c. Demand for car accessories – The effect is indirect. Demand for accessories used mainly with petrol cars may fall if the use or purchase of petrol cars falls. Demand for general car accessories may not necessarily fall if buyers shift to diesel or electric cars.
d. Demand for public transport – It is likely to increase because people may shift from private vehicles to buses, trains or the metro to reduce travel costs.
A farmer traditionally irrigates fields manually (labour-intensive). He installs drip irrigation (a technology upgrade) that reduces water use by 40 per cent and increases yield by 30 per cent. How does this affect
a. His cost of production
b. His willingness to supply at different prices
c. The overall market supply if many farmers adopt this technology
Answer
a. His cost of production – Drip irrigation requires an initial investment, but it reduces water use and labour requirements. Over time, the cost per unit of output is likely to fall, especially because yield increases by 30 per cent.
b. His willingness to supply at different prices – It will increase because lower unit costs and higher yield make production more profitable. The farmer can supply a larger quantity at different prices than before.
c. The overall market supply – If many farmers adopt drip irrigation, market supply will increase. The market supply curve will shift to the right. If demand remains unchanged, the new equilibrium is likely to have a lower price and a higher quantity.
During online festival sales, the prices of many products are very low. Use the concept of demand and supply to explain why the sellers sell at such a low price. What happens to the equilibrium when the price is lowered? Does this benefit only consumers or sellers as well? Explain.
Answer
During online festival sales, sellers may reduce prices to attract more buyers, increase sales and clear stocks.
- According to the Law of Demand, a lower price generally increases the quantity demanded.
- Sellers may also prepare for festival demand by keeping more stock available.
- If the price is temporarily lowered below the prevailing equilibrium price while supply remains unchanged, quantity demanded will exceed quantity supplied, creating excess demand.
- Consumers benefit because they can buy goods at lower prices.
- Sellers may also benefit through higher sales volume, faster stock clearance and increased customer traffic. However, total revenue does not necessarily rise in every case because it depends on how much the quantity sold increases.
Thus, festival discounts can benefit both consumers and sellers, while the market continues to adjust according to demand and supply.
Suppose the government sets a maximum sale price for an essential vaccine below the market-driven price. What is likely to happen? Choose from the options below and elucidate your point.
- Surplus
- Shortage
- No effect
- Fall in demand
Answer
Shortage
Reason — A maximum price fixed below the market equilibrium price is a binding price ceiling. At this lower price, the quantity demanded exceeds the quantity supplied, creating a shortage. The lower price may also reduce producers’ incentives to supply, worsening the shortage.
A surplus would occur if a price were fixed above the equilibrium price, while there would be no effect if the ceiling were set above the equilibrium price. Demand would not fall because a lower price generally increases the quantity demanded.
The government levies higher taxes on products such as tobacco and alcohol to promote healthier choices among citizens. Can you find out other goods where price controls have been set in place? What are the reasons for the same?
Answer
Yes. Price controls may be used for essential goods and services when the government wants to protect consumers or workers.
- Essential medicines – The government fixes ceiling prices for specified essential medicines to keep them affordable and prevent overcharging.
- Essential commodities during emergencies – In 2020, the government temporarily regulated the prices of hand sanitisers to prevent overcharging and ensure availability during an emergency.
- Wages – Minimum wages act as a price floor to protect workers from unduly low wages.
- Food commodities – Instead of fixing a maximum retail price for wheat generally, the government may use measures such as stock limits to prevent hoarding and artificial scarcity and to moderate prices.
Reasons for such controls
- To keep essential goods and services affordable.
- To protect vulnerable and low-income groups.
- To prevent overcharging, hoarding and black-marketing.
- To promote fairness and protect public welfare.
Can excessive government regulation hurt markets? Explain with suitable examples.
Answer
Yes. Although regulation may be necessary to protect public welfare, excessive government intervention can have adverse effects.
- Price distortions and reduced producer incentives – If the government fixes a maximum price below the market level, producers may reduce supply. For example, if wheat could sell at ₹30 per kg but the maximum price is fixed at ₹20 per kg, farmers may reduce production or supply.
- Compliance burdens – Too many licences, permits and procedures can increase costs and discourage businesses, especially small enterprises.
- Reduced innovation and entrepreneurship – Heavy regulation or strict price controls may reduce the incentive to invest in better technology or new production methods.
Therefore, regulation should protect consumers and workers without unnecessarily discouraging production, investment and innovation.
In the table below, different prices of guava are given.
a. Think and write how much guava you will buy at each price.
b. Ask the same question to three of your friends and fill in the table.
c. Also make a graph for each one of you and one final graph for the total quantity.
| Price | You | Friend 1 | Friend 2 | Friend 3 | Total |
|---|---|---|---|---|---|
| ₹100/kg | |||||
| ₹80/kg | |||||
| ₹50/kg | |||||
| ₹20/kg |
Answer
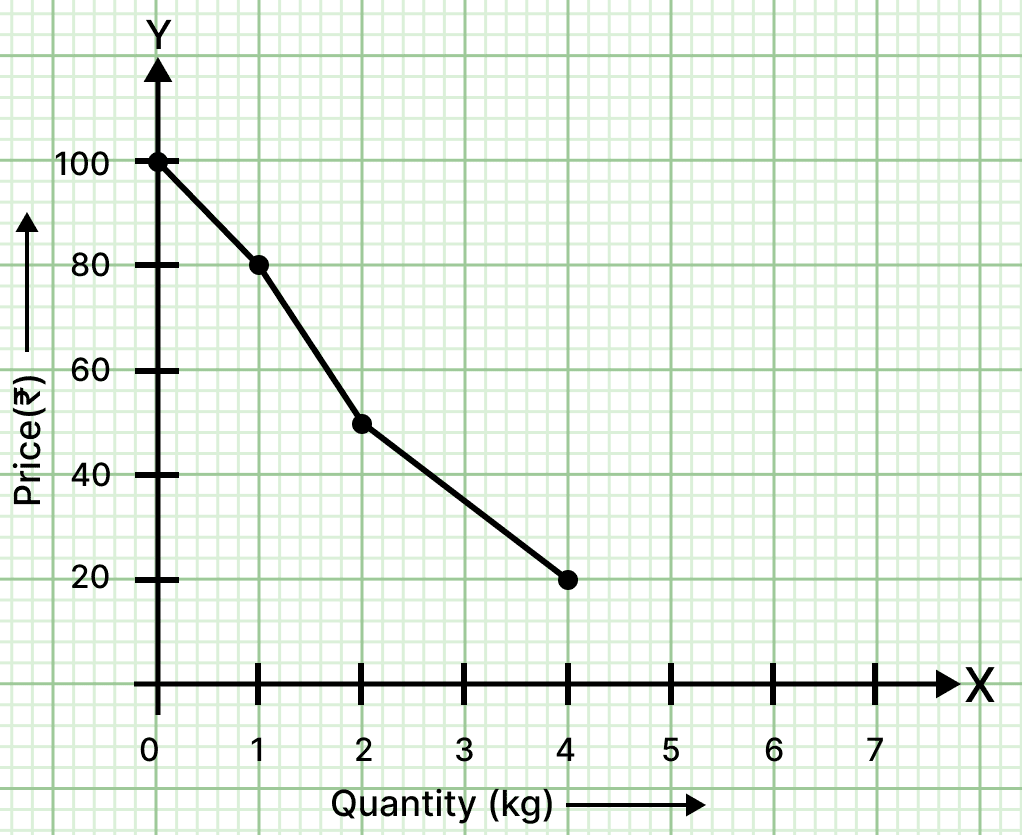
a. and b. A possible table, filled with my own answers and the answers of three of my friends, is given below:
| Price | You | Friend 1 | Friend 2 | Friend 3 | Total |
|---|---|---|---|---|---|
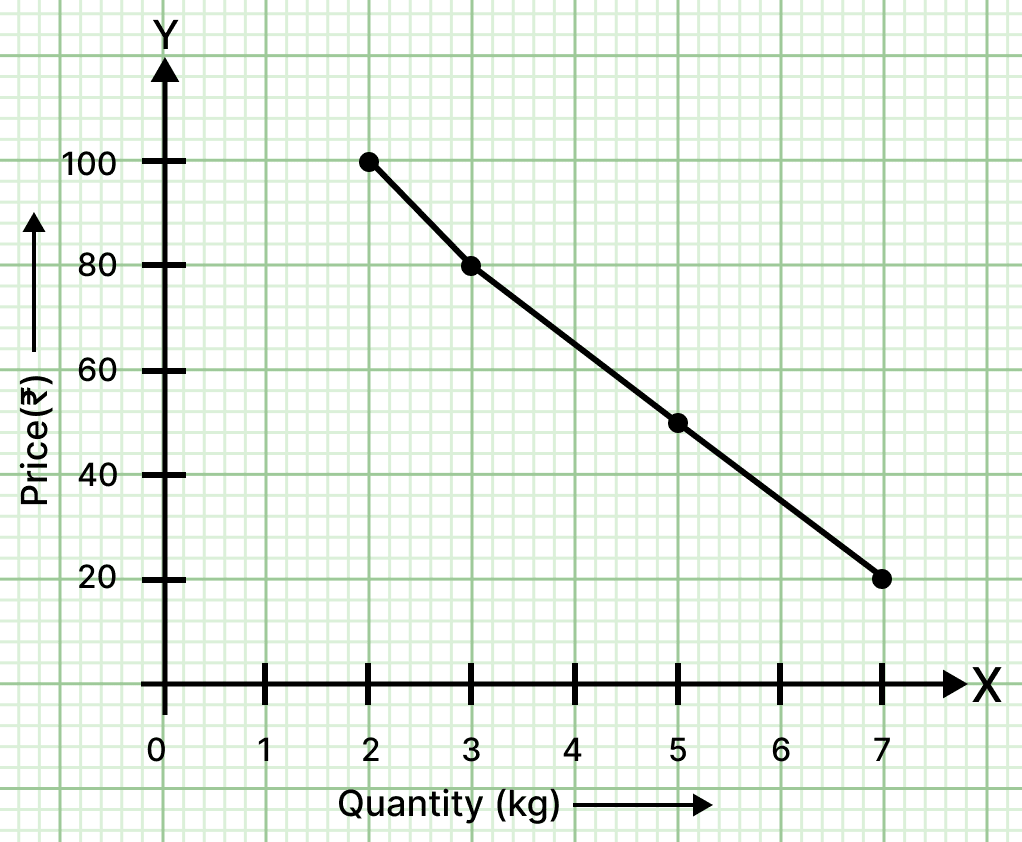
| ₹100/kg | 1 | 1 | 2 | 0 | 4 |
| ₹80/kg | 2 | 2 | 3 | 1 | 8 |
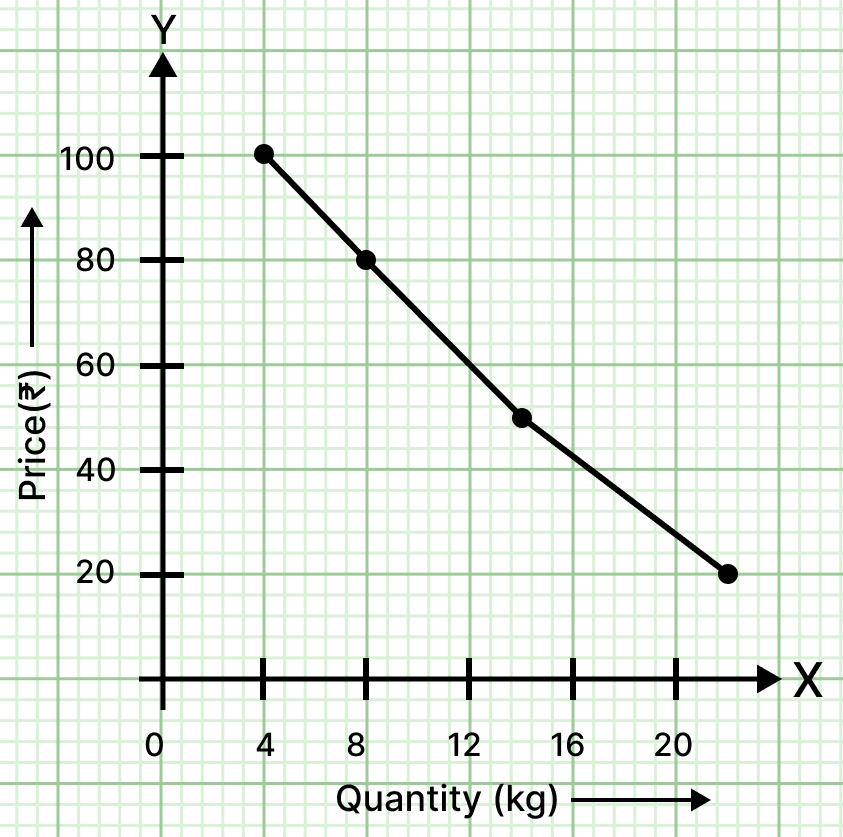
| ₹50/kg | 3 | 4 | 5 | 2 | 14 |
| ₹20/kg | 5 | 6 | 7 | 4 | 22 |
(All quantities are in kg.)
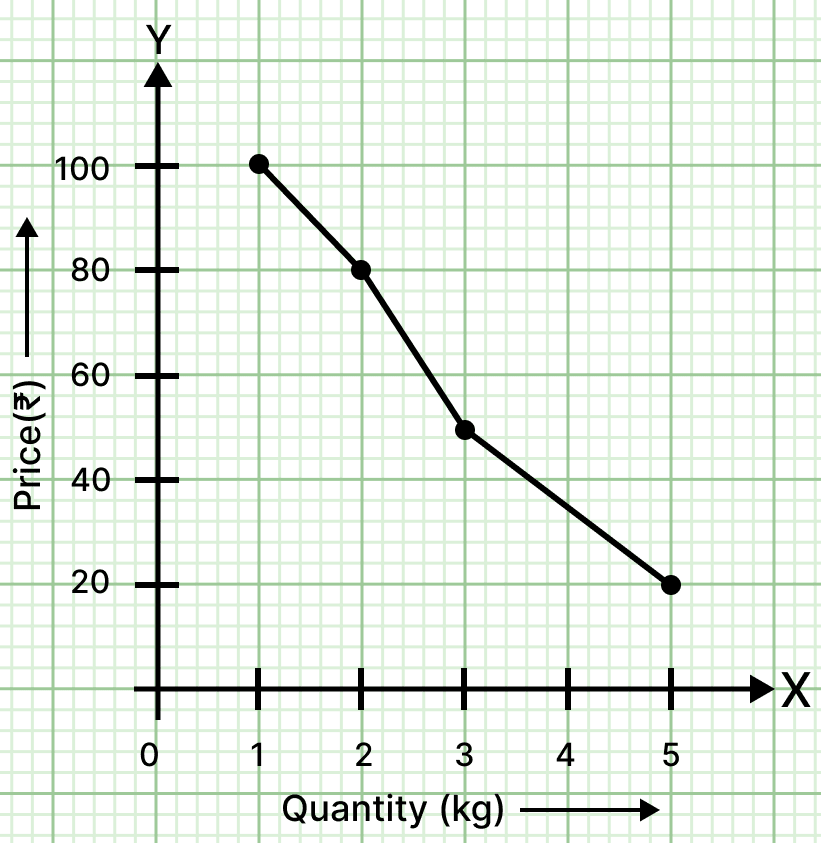
c. Taking price on the Y-axis and quantity of guava on the X-axis, the points of each person are plotted and joined to get four individual demand curves, and the figures in the ‘Total’ column are plotted in the same way to get the market demand curve.
Observations
- Each demand curve slopes downward, showing the inverse relationship between the price of guava and its quantity demanded, which is the Law of Demand.
- The total column is the sum of all individual demand, that is, the market demand for guava.
- The market demand curve is flatter than each individual demand curve, because market demand aggregates many consumers, so the same price change creates a larger total quantity response.
Categorise the following combination of goods into substitute goods and complementary goods.
a. Movie ticket in the cinema hall and popcorn
b. Eraser and pencil
c. Laptop and computer
d. Air Conditioner and cooler
e. Notebook and pen
f. Apple and banana
g. Mobile and earphones
Answer
Substitute goods are goods that can replace each other, while complementary goods are goods that are generally used together to provide utility to the consumer.
| Combination of goods | Category |
|---|---|
| a. Movie ticket in the cinema hall and popcorn | Complementary goods |
| b. Eraser and pencil | Complementary goods |
| c. Laptop and computer | Substitute goods |
| d. Air Conditioner and cooler | Substitute goods |
| e. Notebook and pen | Complementary goods |
| f. Apple and banana | Substitute goods |
| g. Mobile and earphones | Complementary goods |
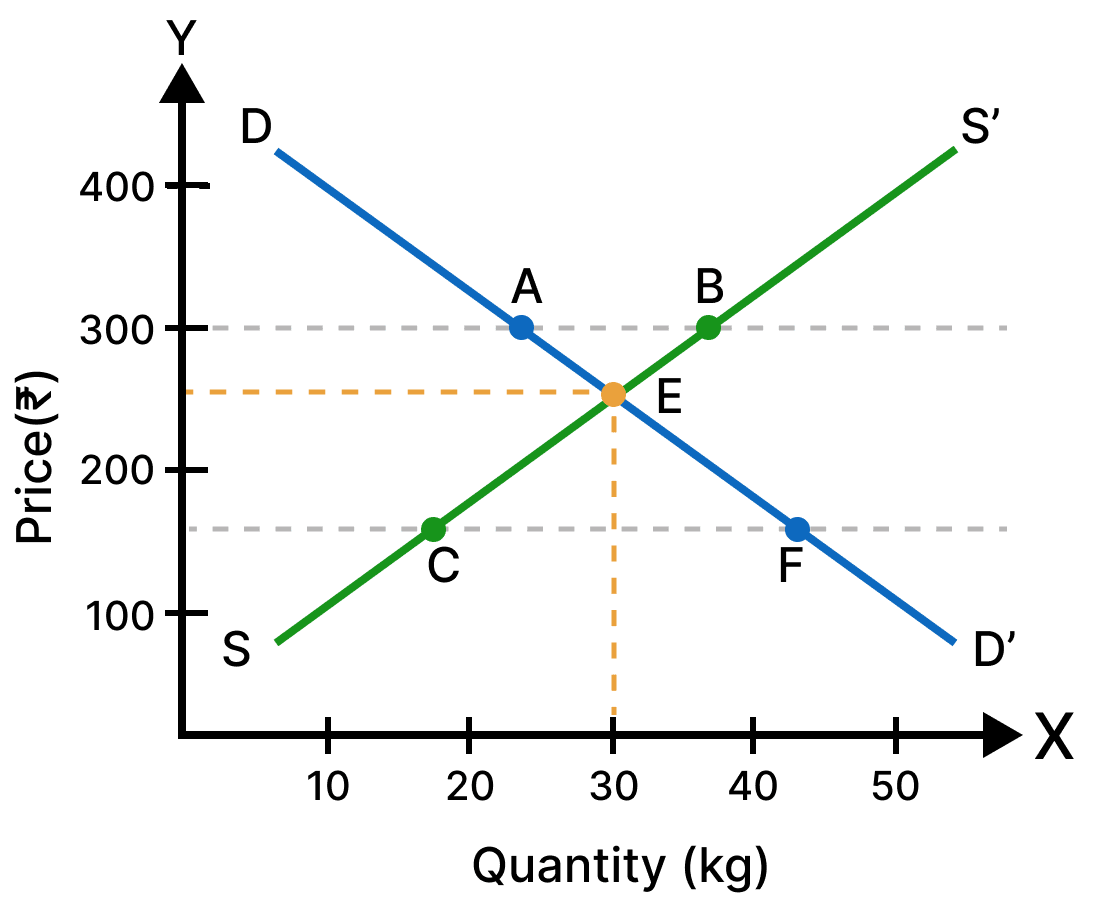
Fig. 9.8 shows the demand curve DD' and Supply curve SS'. Based on the figure, answer the following questions:
a. What does point E represent in this market?
b. What is the equilibrium price and equilibrium quantity at point E?
c. Point A lies on DD'. Point B lies on SS'. What do the points A and B indicate about demand and supply? What does the gap between A and B (both on the upper dashed price line) represent?
d. Point F lies on DD'. Point C lies on SS'. What do the points F and C indicate about demand and supply? What does the gap between C and F (both on the lower dashed price line) represent?
e. If the price stays at the lower dashed line, what could happen next in a free market?
Answer
a. Point E represents market equilibrium. It is the point where the demand curve DD’ intersects the supply curve SS’, so quantity demanded equals quantity supplied.
b. At point E, the equilibrium price is about ₹250 and the equilibrium quantity is 30 kg.
c. Both A and B lie on the upper dashed price line of ₹300, which is above the equilibrium price.
- Point A lies on the demand curve DD’ and shows the quantity demanded at ₹300, which is about 24 kg.
- Point B lies on the supply curve SS’ and shows the quantity supplied at ₹300, which is about 37 kg.
- At this higher price, the quantity supplied is greater than the quantity demanded, so the gap between A and B represents excess supply (surplus).
d. Both C and F lie on the lower dashed price line, which is below the equilibrium price.
- Point F lies on the demand curve DD’ and shows the quantity demanded at this lower price, which is about 43 kg.
- Point C lies on the supply curve SS’ and shows the quantity supplied at this price, which is about 17 kg.
- At this lower price, the quantity demanded is greater than the quantity supplied, so the gap between C and F represents excess demand (shortage).
e. If the price stays at the lower dashed line, there will be a shortage in the market, as buyers want much more than the sellers are willing to offer. In a free market, buyers competing for the limited quantity will push the price up. As the price rises, the quantity supplied increases and the quantity demanded falls, and the market moves back towards the equilibrium at point E, where the quantity demanded equals the quantity supplied.
Draw a market equilibrium graph using the following demand schedule.
| Price (₹) | 10 | 20 | 30 | 40 | 50 |
|---|---|---|---|---|---|
| Q.D. (kg) | 5 | 10 | 15 | 20 | 25 |
| Q.S. (kg) | 25 | 20 | 15 | 10 | 5 |
a. Plot the demand and supply curve using the above data.
b. Identify the equilibrium price and quantity.
c. Observe the above data and analyse what happens if the price is set at ₹20 or ₹40.
Answer
a. Price is taken on the Y-axis and quantity on the X-axis. The pairs of price and quantity demanded are plotted and joined to get the demand curve, and the pairs of price and quantity supplied are plotted and joined to get the supply curve. The two curves cut each other at the price of ₹30.
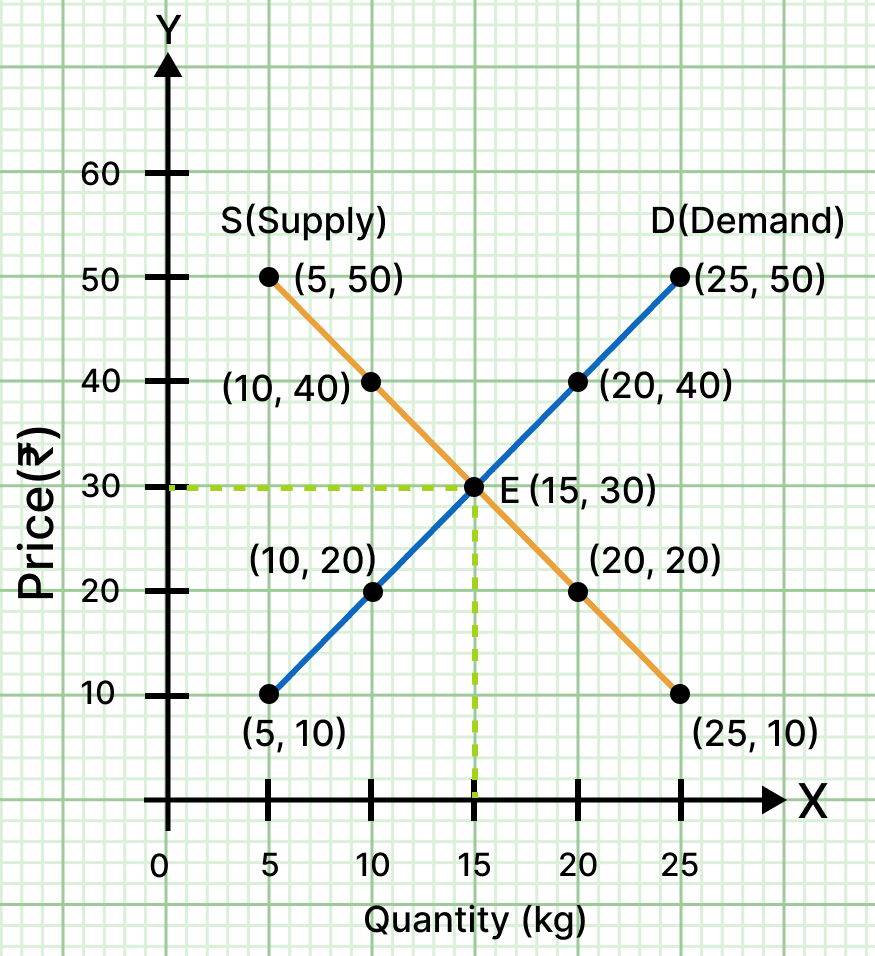
b. The equilibrium price is ₹30 and the equilibrium quantity is 15 kg, because at this price the quantity demanded and the quantity supplied are equal at 15 kg. This is the point where the demand curve and the supply curve intersect.
c. At ₹20 and at ₹40, the market is not in equilibrium, as the quantity demanded and the quantity supplied are not equal.
- At ₹20, the schedule shows a quantity of 10 kg in the Q.D. row and 20 kg in the Q.S. row, that is, a gap of 10 kg.
- At ₹40, the schedule shows a quantity of 20 kg in the Q.D. row and 10 kg in the Q.S. row, again a gap of 10 kg.
- Read in the usual way, that is, with the quantity demanded falling and the quantity supplied rising as the price rises, ₹20 lies below the equilibrium price and shows an excess demand (shortage) of 10 kg, while ₹40 lies above the equilibrium price and shows an excess supply (surplus) of 10 kg.
- In a free market, such gaps do not last. A shortage pushes the price up and a surplus pushes it down, until the price returns to ₹30, where the quantity demanded once again equals the quantity supplied.