
Mathematics
40 students enter for a game of shot put competition. The distance thrown (in metres) is recorded below.
| Distance (in m) | Number of students |
|---|---|
| 12 - 13 | 3 |
| 13 - 14 | 9 |
| 14 - 15 | 12 |
| 15 - 16 | 9 |
| 16 - 17 | 4 |
| 17 - 18 | 2 |
| 18 - 19 | 1 |
Use a graph paper to draw an ogive for the above distribution.
Use a scale of 2 cm = 1 m on one axis and 2 cm = 5 students on the other axis. Hence using your graph, find
(i) the median
(ii) Upper quartile
(iii) Number of students who cover a distance which is above 16 m.
Measures of Central Tendency
1 Like
Answer
Cumulative frequency distribution table :
| Distance in m | No. of students | Cumulative frequency |
|---|---|---|
| 12 - 13 | 3 | 3 |
| 13 - 14 | 9 | 12 |
| 14 - 15 | 12 | 24 |
| 15 - 16 | 9 | 33 |
| 16 - 17 | 4 | 37 |
| 17 - 18 | 2 | 39 |
| 18 - 19 | 1 | 40 |
Steps of construction:
Since, the scale on x-axis starts at 12, a break (kink) is shown near the origin on x-axis to indicate that the graph is drawn to scale beginning at 12.
Take 2 cm along x-axis = 1 m.
Take 2 cm along y-axis = 5 students.
Plot the point (12, 0) as ogive starts from x-axis representing lower limit of first class.
Plot the points (13, 3), (14, 12), (15, 24), (16, 33), (17, 37), (18, 39) and (19, 40).
Join the points by a free hand curve.
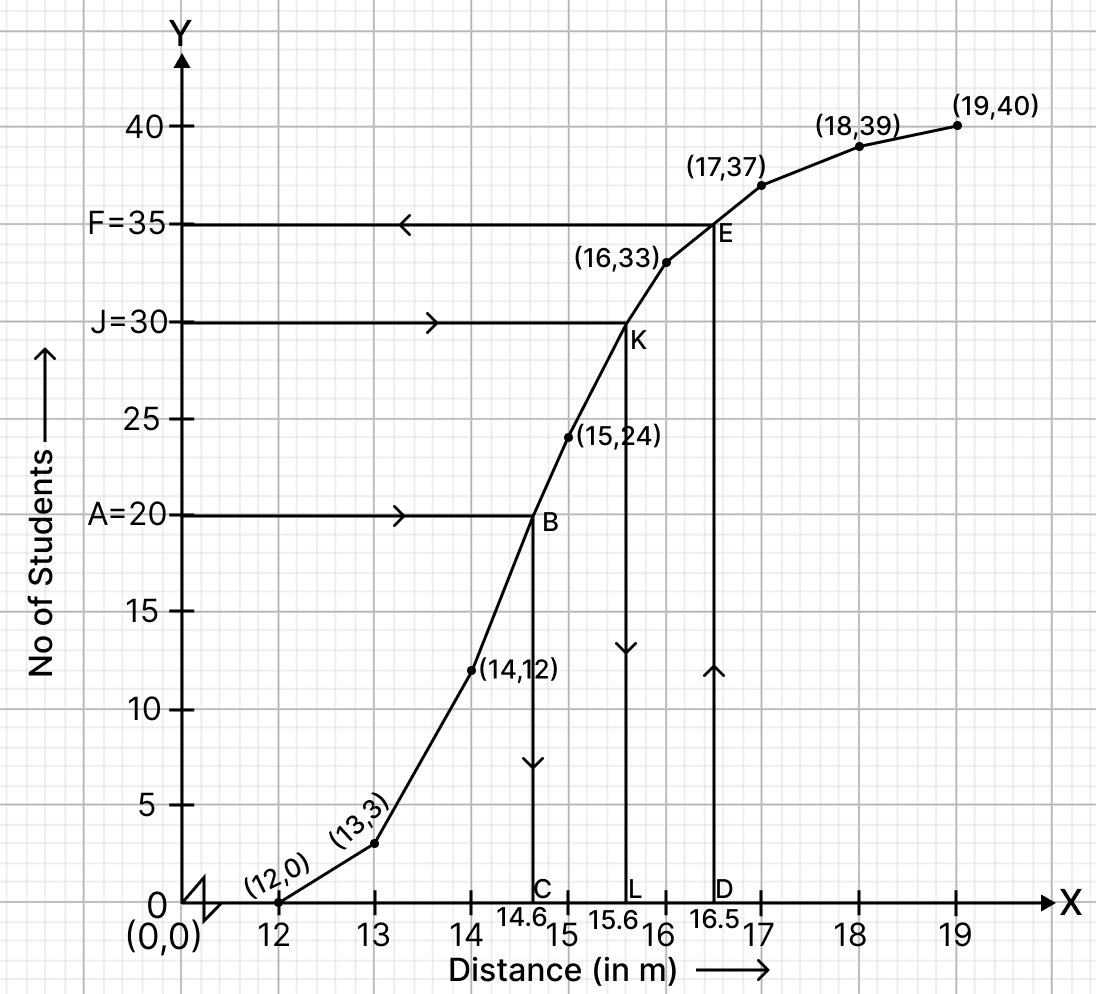
(i) The total number of students is N = 40. The median position is found at = 20.
Draw a line parallel to x-axis from point A (number of students) = 20, touching the graph at point B. From point B draw a line parallel to y-axis touching x-axis at point C.
From graph, C = 14.6
Hence, the median = 14.6 m.
(ii) Here, n = 40, which is even.
By formula,
Upper quartile = = 30.
Draw a line parallel to x-axis from point J (number of students) = 30, touching the graph at point K. From point K draw a line parallel to y-axis touching x-axis at point L.
From graph, L = 15.6
Hence, the upper quartile = 15.6 m.
(iii) Draw a line parallel to y-axis from point D (Distance) = m = 16.5 m, touching the graph at point E. From point E draw a line parallel to x-axis touching y-axis at point F.
From graph, F = 35.
It means there are 35 students who cover a distance either less or equal to m.
Number of student who cover a distance which is above m = 40 - 35 = 5.
Hence, number of students who cover a distance above m = 5.
Answered By
1 Like
Related Questions
The table shows the distribution of the scores obtained by 160 shooters in a shooting competition. Use a graph sheet and draw an ogive for the distribution (take 2 cm = 10 scores on the x-axis and 2 cm = 20 shooters on the y-axis.)
Scores Number of shooters 0 - 10 9 10 - 20 13 20 - 30 20 30 - 40 26 40 - 50 30 50 - 60 22 60 - 70 15 70 - 80 10 80 - 90 8 90 - 100 7 Use your graph to estimate the following:
(i) the median
(ii) the inter-quartile range
(iii) the number of shooters who obtained a score of more than 85%
A survey regarding height (in cm) of 60 boys belonging to class 10 of a school was conducted. The following data was recorded:
Height (in cm) Number of boys 135 - 140 4 140 - 145 8 145 - 150 20 150 - 155 14 155 - 160 7 160 - 165 6 165 - 170 1 Taking 2 cm = height of 10 cm along one axis and 2 cm = 10 boys along the other axis, draw an ogive of the above distribution. Use the graph to estimate the following :
(i) the median
(ii) the lower quartile
(iii) if above 158 cm is considered as the tall boys of the class, find the number of boys in the class who are tall.
Use graph paper to answer this question:
During a medical checkup of 60 students in a school, weights were recorded as follows:
Weight (in kg) Number of students 28 - 30 2 30 - 32 4 32 - 34 10 34 - 36 13 36 - 38 15 38 - 40 9 40 - 42 5 42 - 44 2 Taking 2 cm = 2 kg along one axis and 2 cm = 10 students along the other axis, draw an ogive. Use your graph to find the:
(i) Median
(ii) Upper quartile
(iii) Number of students whose weight is above 37 kg
Calculate the mean, median and mode of the following numbers:
(i) 17, 19, 11, 23, 19
(ii) 7, 9, 8, 11, 8, 12, 8, 9
(iii) 2, 1, 0, 3, 1, 2, 3, 4, 3, 5
(iv) 8, 10, 7, 6, 10, 11, 6, 13, 10