Science
(a) A driver of a car travelling at 52 kmh-1 applies the brakes. Shade the area on the graph that represents the distance travelled by the car during the period.

(b) Which part of the graph represents uniform motion of the car?
Answer
(a) The initial speed of the car is 52 kmh-1. After the driver applies the brakes, the speed becomes zero.
The x-axis of the graph represents the time and the y-axis of the graph represents the velocity.
In the graph, point B represents the initial velocity of the car, that is, 52 kmh-1, and point T represents the time when the velocity becomes zero.
The distance travelled by an object is equal to the product of velocity and time.
Therefore, the area under the velocity-time graph represents the distance travelled by the car during the period as shown below :
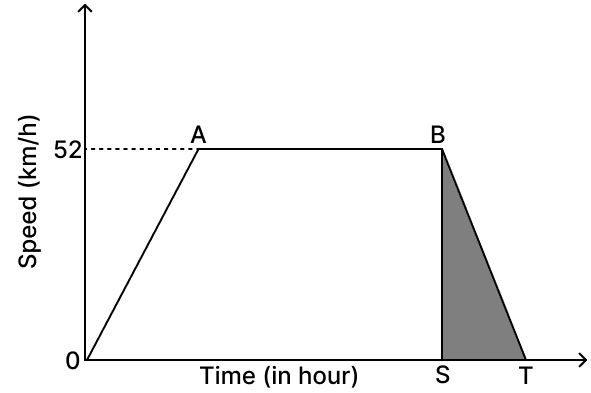
Distance travelled by the car = Area of triangle BST.
(b) As the slope of portion AB is constant which means velocity is constant during this portion and hence portion AB represents the portion of uniform motion.
Related Questions
Abdul, while driving to school, computes the average speed for his trip to be 20 kmh-1. On his return trip along the same route, there is less traffic and the average speed is 30 kmh-1. What is the average speed for Abdul's trip?
A motorboat starting from rest on a lake accelerates in a straight line at a constant rate of 3.0 ms-2 for 8.0 s. How far does the boat travel during this time?
Fig below shows the distance-time graph of three objects A, B and C. Study the graph and answer the following questions:

(a) Which of the three is travelling the fastest?
(b) Are all three ever at the same point on the road?
(c) How far has C travelled when B passes A?
(d) How far has B travelled by the time it passes C?
A ball is gently dropped from a height of 20 m. If its velocity increases uniformly at the rate of 10 ms-2, with what velocity will it strike the ground? After what time will it strike the ground?