Robotics & Artificial Intelligence

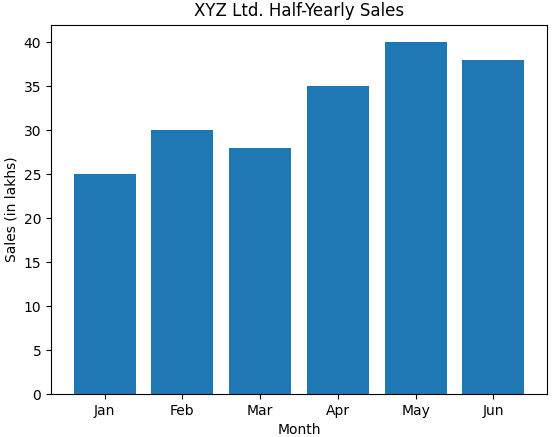
A company XYZ Ltd. records its monthly sales in lakhs as follows:

Month = ['Jan', 'Feb', 'Mar', 'Apr', 'May', 'Jun']
Sales = [25, 30, 28, 35, 40, 38]

Write a Python program using Matplotlib to:

  1. Store the data.
  2. Plot a bar chart with month on X-axis and sales on Y-axis.
  3. Label the axes and give a title "XYZ Ltd. Half-Yearly Sales"

Python Modules

1 Like

Answer

import matplotlib.pyplot as plt

month = ['Jan', 'Feb', 'Mar', 'Apr', 'May', 'Jun']
sales = [25, 30, 28, 35, 40, 38]

plt.bar(month, sales)
plt.xlabel("Month")
plt.ylabel("Sales (in lakhs)")
plt.title("XYZ Ltd. Half-Yearly Sales")
plt.show()

Output

A company XYZ Ltd. records its monthly sales in lakhs as follows.ICSE 2026 Robotics & Artificial Intelligence Solved Question Paper.

Answered By

1 Like


Related Questions