
Mathematics
Construct a frequency distribution table for the numbers given below, using the class intervals 21 - 30, 31 - 40, ….., etc.
75, 67, 57, 50, 26, 33, 44, 58, 67, 75, 78, 43, 41, 31, 21, 32, 40, 62, 54, 69, 48, 47, 51, 38, 39, 43, 61, 63, 68, 53, 56, 49, 59, 37, 40, 68, 23, 28, 36 and 47.
Use the table obtained to draw :
(i) a histogram
(ii) an ogive
Statistics
3 Likes
Answer
Frequency distribution table :
| Class intervals | Frequency |
|---|---|
| 21 - 30 | 4 |
| 31 - 40 | 9 |
| 41 - 50 | 9 |
| 51 - 60 | 7 |
| 61 - 70 | 8 |
| 71 - 80 | 3 |
(i) The above distribution is discontinuous, converting into continuous distribution, we get :
Adjustment factor = (Lower limit of one class - Upper limit of previous class) / 2
=
= 0.5
Subtract the adjustment factor (0.5) from all the lower limits and add the adjustment factor (0.5) to all the upper limits.
| Class before adjustment | Class after adjustment | Frequency | Cumulative frequency |
|---|---|---|---|
| 21 - 30 | 20.5 - 30.5 | 4 | 4 |
| 31 - 40 | 30.5 - 40.5 | 9 | 13 (4 + 9) |
| 41 - 50 | 40.5 - 50.5 | 9 | 22 (13 + 9) |
| 51 - 60 | 50.5 - 60.5 | 7 | 29 (22 + 7) |
| 61 - 70 | 60.5 - 70.5 | 8 | 37 (29 + 8) |
| 71 - 80 | 70.5 - 80.5 | 3 | 40 (37 + 3) |
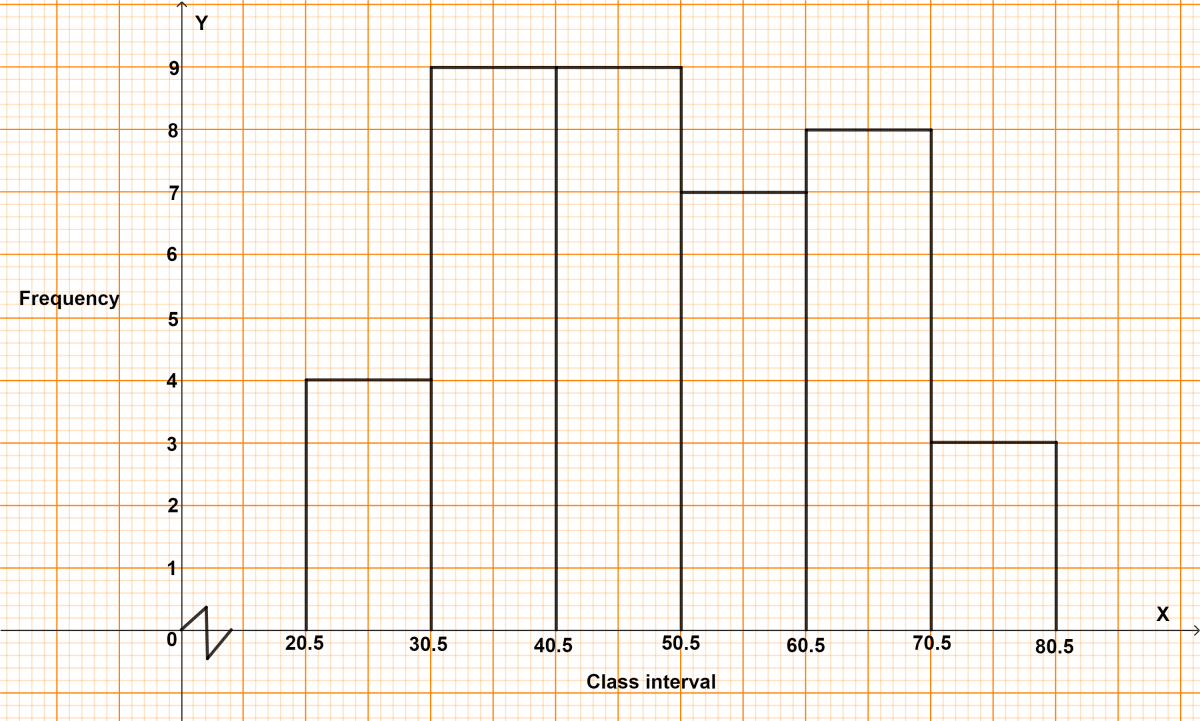
Steps of construction of histogram :
Since, the scale on x-axis starts at 20.5, a break (kink) is shown near the origin on x-axis to indicate that the graph is drawn to scale beginning at 20.5
Take 2 cm along x-axis = 10 units.
Take 1 cm along y-axis = 1 unit.
Construct rectangles corresponding to the above continuous frequency distribution table.
The required histogram is shown in the below figure:
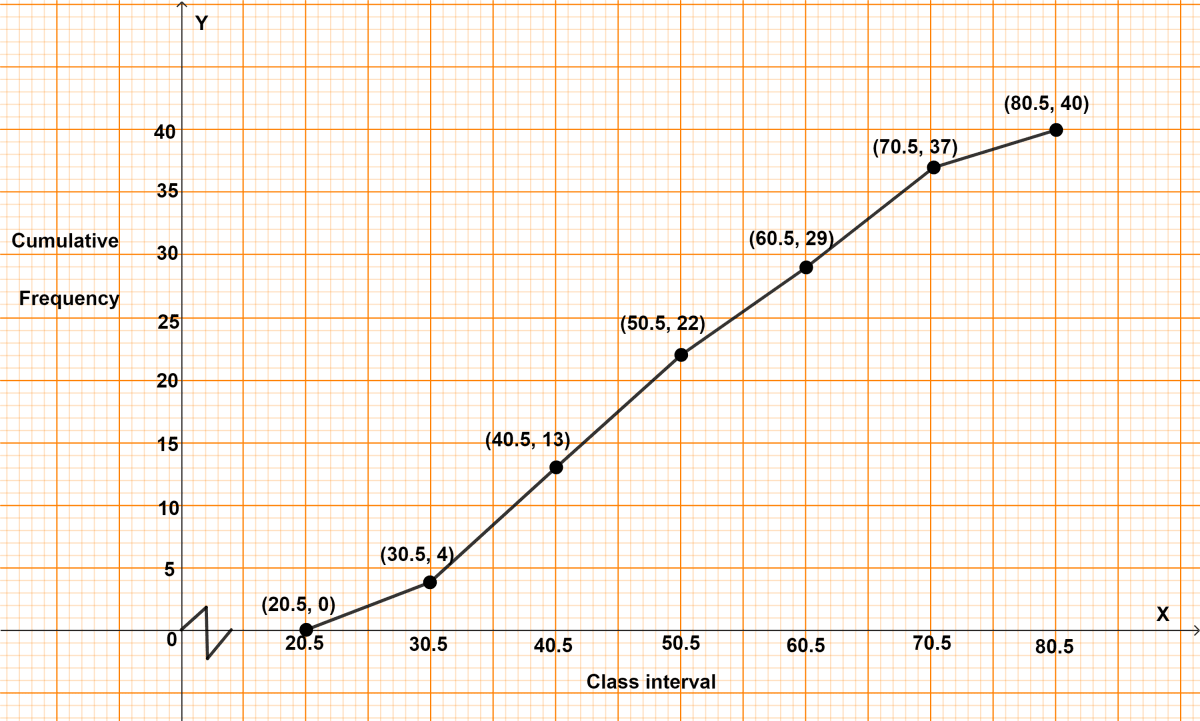
(ii) Steps of construction of ogive :
Since, the scale on x-axis starts at 20.5, a break (kink) is shown near the origin on x-axis to indicate that the graph is drawn to scale beginning at 20.5
Take 2 cm along x-axis = 10 units.
Take 1 cm along y-axis = 5 units.
Ogive always starts from a point on x-axis representing the lower limit of first class. Mark point (20.5, 0).
Take upper class limits along x-axis, corresponding cumulative frequencies along y-axis, mark the points (30.5, 4), (40.5, 13), (50.5, 22), (60.5, 29), (70.5, 37) and (80.5, 40).
Join the points marked by a free hand curve.
The required ogive is shown in the below figure:
Answered By
2 Likes
Related Questions
Use graph paper for this question.
The table given below shows the monthly wages of some factory workers.
(i) Using the table, calculate the cumulative frequencies of workers.
(ii) Draw a cumulative frequency curve.
Wages (in ₹) No. of workers 6500 - 7000 10 7000 - 7500 18 7500 - 8000 22 8000 - 8500 25 8500 - 9000 17 9000 - 9500 10 9500 - 10000 8 The following table shows the distribution of the heights of a group of factory workers :
Ht. (cm) No. of workers 150 - 155 6 155 - 160 12 160 - 165 18 165 - 170 20 170 - 175 13 175 - 180 8 180 - 185 6 (i) Determine the cumulative frequencies.
(ii) Draw the 'less than' cumulative frequency curve on graph paper.
Construct a frequency distribution table for the following distribution :
Marks (less than) Cumulative frequency 0 0 10 7 20 28 30 54 40 71 50 84 60 105 70 147 80 180 90 196 100 200 Construct a frequency distribution table for the following distribution :
Marks (more than) Cumulative frequency 0 100 10 87 20 65 30 55 40 42 50 36 60 31 70 21 80 18 90 7 100 0