
Mathematics
The daily wages of 80 workers in a project are given below:
| Wages (in ₹) | Number of workers |
|---|---|
| 400 - 450 | 2 |
| 450 - 500 | 6 |
| 500 - 550 | 12 |
| 550 - 600 | 18 |
| 600 - 650 | 24 |
| 650 - 700 | 13 |
| 700 - 750 | 5 |
Use a graph paper to draw an ogive for the above distribution. (Use a scale of 2 cm = ₹ 50 on x-axis and 2 cm = 10 workers on y-axis). Use your ogive to estimate:
(i) the median wage of the workers.
(ii) the lower quartile wage of the workers.
(iii) the number of workers who earn more than ₹ 625 daily.
Measures of Central Tendency
2 Likes
Answer
Cumulative frequency distribution table :
| Wages (in ₹) | Number of workers | Cumulative frequency |
|---|---|---|
| 400 - 450 | 2 | 2 |
| 450 - 500 | 6 | 8 (2 + 6) |
| 500 - 550 | 12 | 20 (8 + 12) |
| 550 - 600 | 18 | 38 (20 + 18) |
| 600 - 650 | 24 | 62 (38 + 24) |
| 650 - 700 | 13 | 75 (62 + 13) |
| 700 - 750 | 5 | 80 (75 + 5) |
Here, n = 80, which is even.
Steps of construction:
Take 2 cm along x-axis = ₹ 50
Take 2 cm along y-axis = 10 workers
Since, scale on x-axis starts at 400, a kink is shown near the origin on x-axis to indicate that the graph is drawn to scale beginning at 400.
Plot the points (450, 2), (500, 8), (550, 20), (600, 38), (650, 62), (700, 75), (750, 80) representing upper class limits and the respective cumulative frequencies. Also plot the point representing lower limit of the first class i.e, 400 - 450.
Joint the points by a free hand curve.
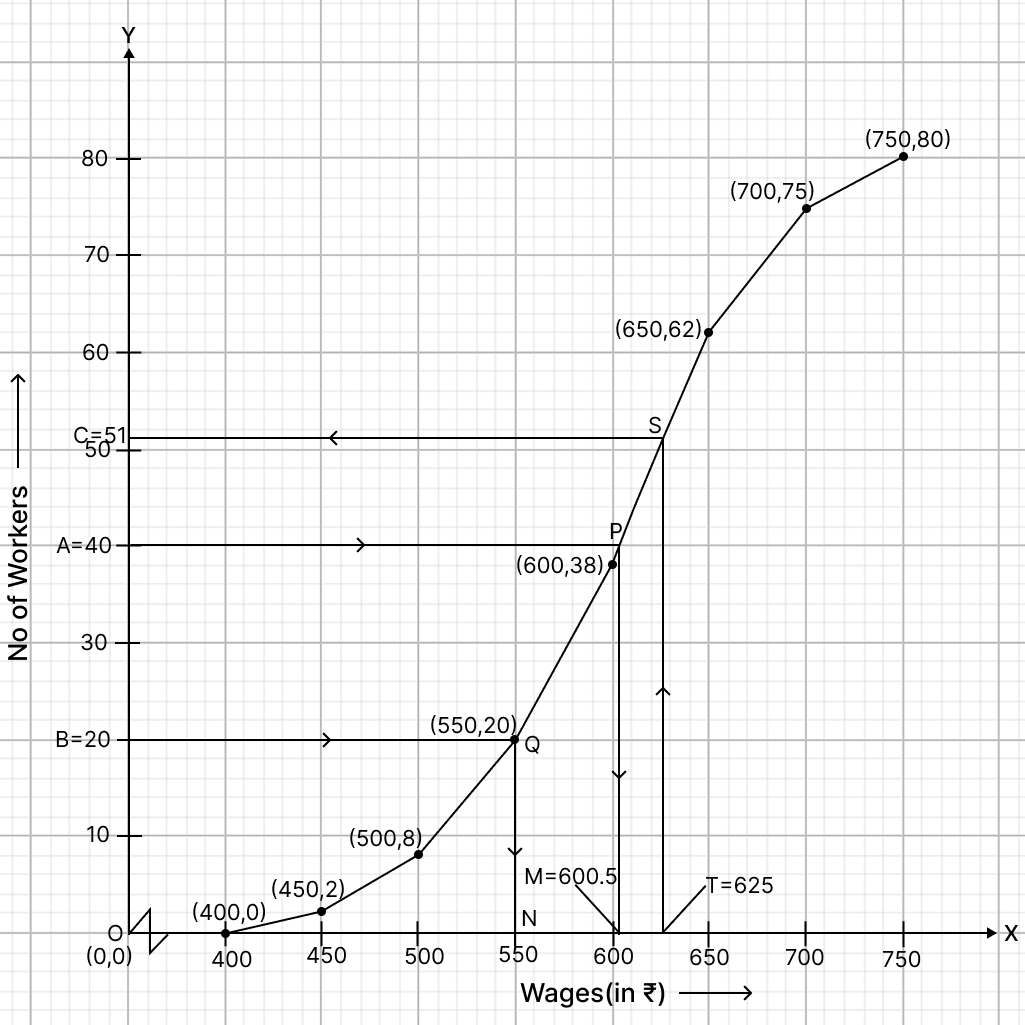
(i) Here, n = 80
To find the median :
Let A be the point on y-axis representing frequency = = 40.
Through A draw a horizontal line to meet the ogive at P. Through P, draw a vertical line to meet the x-axis at M. The abscissa of the points M represents 600.5.
Hence, the median is ₹ 600.5.
(ii) To find lower quartile:
Let B be the point on y-axis representing frequency = = 20.
Through B, draw a horizontal line to meet the ogive at Q. Through Q, draw a vertical line to meet the x-axis at N. The abscissa of the point N represents 550.
Hence, lower quartile wage = ₹ 550.
(iii) Let T be the point on x-axis representing wage = ₹ 625.
Through T, draw a vertical line to meet the ogive at S. Through S, draw a horizontal line to meet the y-axis at C. The ordinate of the point C. The ordinate of point C represents 51.
Workers who earn less than ₹ 625 = 51.
So, workers earning more than ₹ 625 = Total workers - workers who earn less than ₹ 625 = 80 - 51 = 29.
Hence, there are 29 workers earning more than ₹ 625 daily.
Answered By
1 Like
Related Questions
Marks obtained by 200 students in an examination are given below:
Marks Number of students 0 - 10 5 10 - 20 10 20 - 30 14 30 - 40 21 40 - 50 25 50 - 60 34 60 - 70 36 70 - 80 27 80 - 90 16 90 - 100 12 Draw an ogive for the given distribution taking 2 cm = 10 marks on one axis and 2 cm = 20 students on other axis. From the graph, find:
(i) the median
(ii) the upper-quartile
(iii) number of students scoring more than 65 marks
(iv) if 10 students qualify for merit-scholarship, find the minimum marks required to qualify.
The table below shows the distribution of the scores obtained by 120 shooters in shooting competition. Using a graph sheet, draw an ogive for the distribution.
Scores obtained Number of shooters 0 - 10 5 10 - 20 9 20 - 30 16 30 - 40 22 40 - 50 26 50 - 60 18 60 - 70 11 70 - 80 6 80 - 90 4 90 - 100 3 Use your ogive to estimate :
(i) the median
(ii) the inter-quartile range
(iii) the number of shooters who obtained more than 75% score.
Using a graph paper, draw an ogive for the following distribution which shows a record of the weight in kilograms of 200 students.
Weight (in kg) No. of students 40 - 45 5 45 - 50 17 50 - 55 22 55 - 60 45 60 - 65 51 65 - 70 31 70 - 75 20 75 - 80 9 Use your ogive to estimate the following :
(i) the percentage of students weighing 55 kg or more
(ii) the weight above which the heaviest 30% of the students fall
(iii) the number of students who are (a) under weight and (b) Over-weight, if 55.70 kg is considered as standard weight.
Using a graph paper, draw an ogive for the distribution which shows the marks obtained on the General knowledge paper by 100 students.
Marks No. of students 0 - 10 5 10 - 20 10 20 - 30 20 30 - 40 25 40 - 50 15 50 - 60 12 60 - 70 9 70 - 80 4 Use the ogive to estimate:
(i) the median
(ii) the number of students whose score is above 65.