
Mathematics
For the data given in the following tables, find :
(i) mean
(ii) mode (using graph)
(iii) median (using graph)
(a)
| Class-mark | Frequency |
|---|---|
| 15 | 10 |
| 25 | 12 |
| 35 | 14 |
| 45 | 16 |
| 55 | 8 |
(b)
| Class-mark | Frequency |
|---|---|
| 35 | 8 |
| 40 | 10 |
| 45 | 12 |
| 50 | 15 |
| 55 | 20 |
| 60 | 15 |
Measures of Central Tendency
2 Likes
Answer
(a) Since the difference between two consecutive class-marks is 10, subtract = 5 from each class-mark to get the lower limit and add 5 to get the upper limit.
| Class-mark (x) | Class interval | Frequency (f) | fx | Cumulative frequency |
|---|---|---|---|---|
| 15 | 10 - 20 | 10 | 150 | 10 |
| 25 | 20 - 30 | 12 | 300 | 22 |
| 35 | 30 - 40 | 14 | 490 | 36 |
| 45 | 40 - 50 | 16 | 720 | 52 |
| 55 | 50 - 60 | 8 | 440 | 60 |
| Total | Σf = 60 | Σfx = 2100 |
(i) By formula,
Mean = = 35.
Hence, mean = 35.
(ii) Calculating mode :
Steps of construction :
Draw a histogram of the given distribution.
Inside the highest rectangle, which represents the maximum frequency (or modal class) draw two lines AC and BD diagonally from the upper corners C and D of adjacent rectangles.
Through the point K (the point of intersection of diagonals AC and BD), draw KM perpendicular to the horizontal axis.
The value of point M on the horizontal axis represents the value of mode.
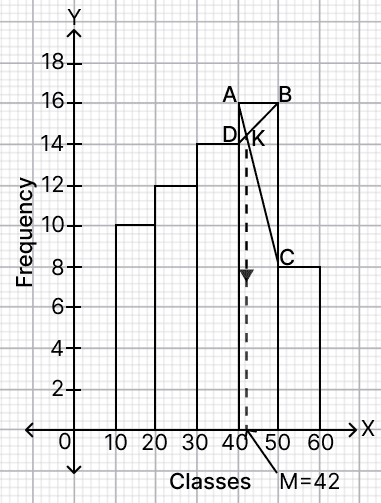
∴ Mode = 42 (approx).
Hence, mode = 42 (approx).
(iii) n = Σf = 60
Median = term = = 30th term.
Steps of construction of ogive :
Take 1 cm = 10 units along x-axis.
Take 1 cm = 10 units along y-axis.
Ogive always starts from a point on x-axis representing the lower limit of the first class. Mark point (10, 0).
Take upper class limits along x-axis and corresponding cumulative frequencies along y-axis, mark the points (20, 10), (30, 22), (40, 36), (50, 52) and (60, 60).
Join the points marked by a free hand curve.
Mark 30 on y-axis, draw a horizontal line which meets the curve at point A.
Through point A, on the curve, draw a vertical line which meets x-axis at point B.
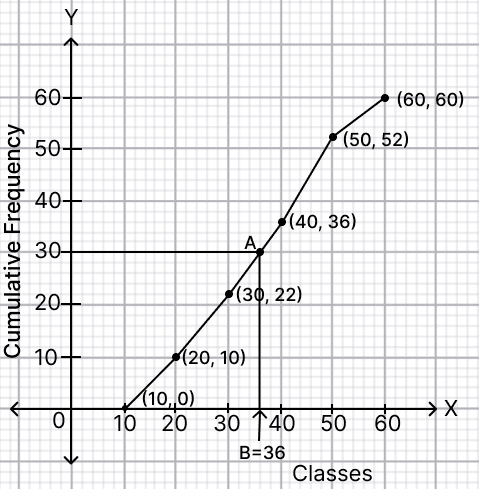
From graph,
B = 36 (approx)
Hence, median = 36 (approx).
(b) Since the difference between two consecutive class-marks is 5, subtract = 2.5 from each class-mark to get the lower limit and add 2.5 to get the upper limit.
| Class-mark (x) | Class interval | Frequency (f) | fx | Cumulative frequency |
|---|---|---|---|---|
| 35 | 32.5 - 37.5 | 8 | 280 | 8 |
| 40 | 37.5 - 42.5 | 10 | 400 | 18 |
| 45 | 42.5 - 47.5 | 12 | 540 | 30 |
| 50 | 47.5 - 52.5 | 15 | 750 | 45 |
| 55 | 52.5 - 57.5 | 20 | 1100 | 65 |
| 60 | 57.5 - 62.5 | 15 | 900 | 80 |
| Total | Σf = 80 | Σfx = 3970 |
(i) By formula,
Mean = = 49.625
Hence, mean = 49.625
(ii) Calculating mode :
Steps of construction :
Draw a histogram of the given distribution.
Inside the highest rectangle, which represents the maximum frequency (or modal class) draw two lines AC and BD diagonally from the upper corners C and D of adjacent rectangles.
Through the point K (the point of intersection of diagonals AC and BD), draw KM perpendicular to the horizontal axis.
The value of point M on the horizontal axis represents the value of mode.
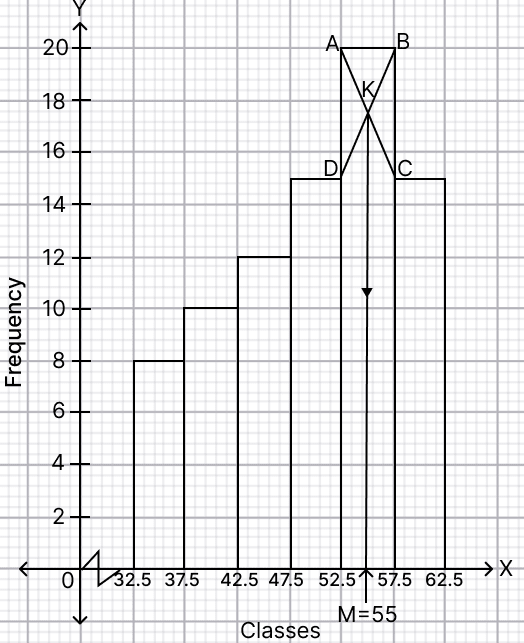
∴ Mode = 55 (approx).
Hence, mode = 55 (approx).
(iii) n = Σf = 80
Median = term = = 40th term.
Steps of construction of ogive :
Take 1 cm = 5 units along x-axis.
Take 1 cm = 10 units along y-axis.
Ogive always starts from a point on x-axis representing the lower limit of the first class. Mark point (32.5, 0).
Take upper class limits along x-axis and corresponding cumulative frequencies along y-axis, mark the points (37.5, 8), (42.5, 18), (47.5, 30), (52.5, 45), (57.5, 65) and (62.5, 80).
Join the points marked by a free hand curve.
Mark 40 on y-axis, draw a horizontal line which meets the curve at point A.
Through point A, on the curve, draw a vertical line which meets x-axis at point B.
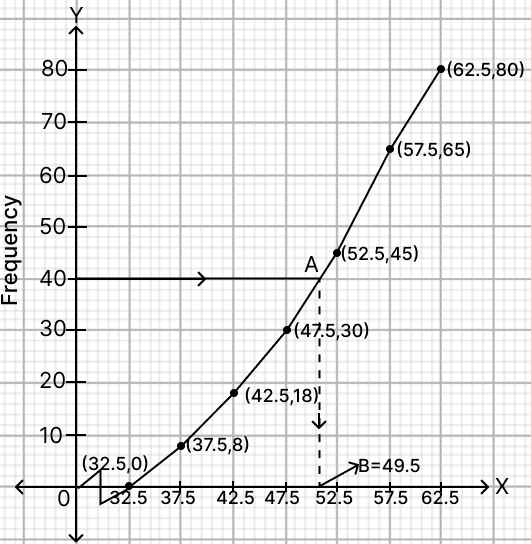
From graph,
B = 49.5 (approx)
Hence, median = 49.5 (approx).
Answered By
2 Likes
Related Questions
The marks of 10 students of a class in an examination arranged in ascending order is as follows :
13, 35, 43, 46, x, x + 4, 55, 61, 71, 80.
If the median marks is 48, find the value of x. Hence, find the mode of the given data.
The histogram below represents the scores obtained by 25 students in a Mathematics mental test. Use the data to :
(i) Frame a frequency distribution table.
(ii) To calculate mean.
(iii) To determine the modal class.

On average, 80 patients get admitted into a nursing home in a day. The ages of the patients admitted and their number are as given below :
Age (in years) No. of patients 10 - 20 13 20 - 30 23 30 - 40 25 40 - 50 14 50 - 60 5 Find :
(i) The average age for which maximum cases occur.
(ii) The upper limit of modal class.
(iii) The mean of the given data.
Along with an increase in population, electricity consumption per person is also increasing nationwide.
A survey is conducted for 560 families of Mangal Pande Nagar, Meerut. The following table gives the monthly consumption of electricity of these families.
Monthly consumption (in units) No. of families 0 - 100 160 100 - 200 120 200 - 300 180 300 - 400 60 400 - 500 40 Assuming that no family consumes more than 500 units of electricity, find :
(i) The mean monthly consumption.
(ii) The modal monthly class.