
Mathematics
Draw the graph for the linear equation given below :
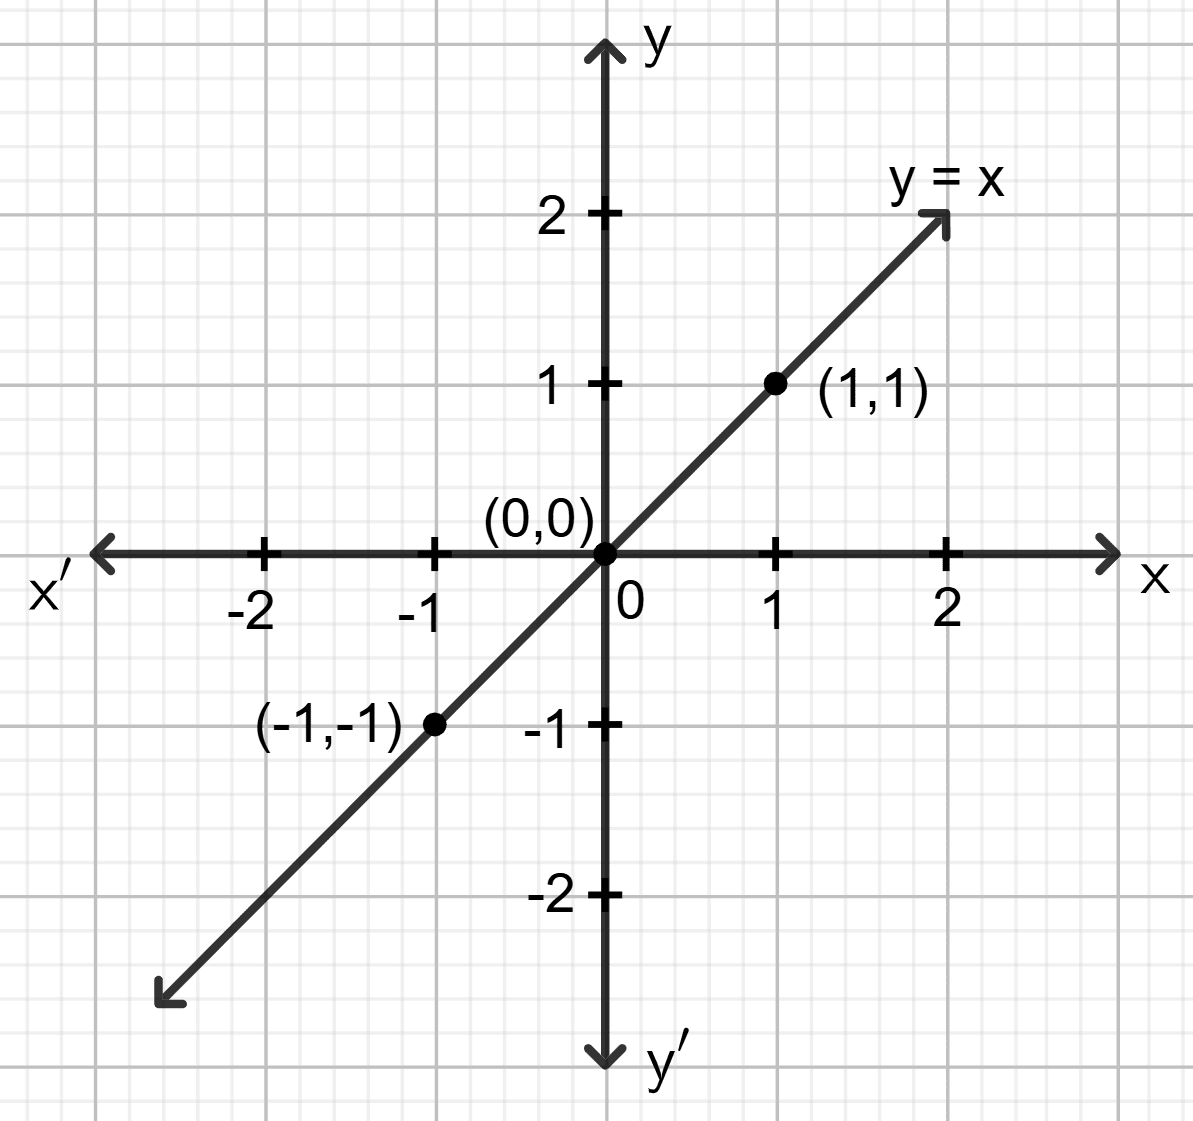
y = x
Coordinate Geometry
6 Likes
Answer
y = x
Step 1:
Give at least three suitable values to the variable x and find the corresponding values of y.
Let x = -1, then y = -1
Let x = 0, then y = 0
Let x = 1, then y = 1
Step 2:
Make a table (as given below) for the different pairs of the values of x and y:
| x | -1 | 0 | 1 |
|---|---|---|---|
| y | -1 | 0 | 1 |
Step 3:
Plot the points, from the table, on a graph paper and then draw a straight line passing through the points plotted on the graph.
Answered By
5 Likes