Mathematics
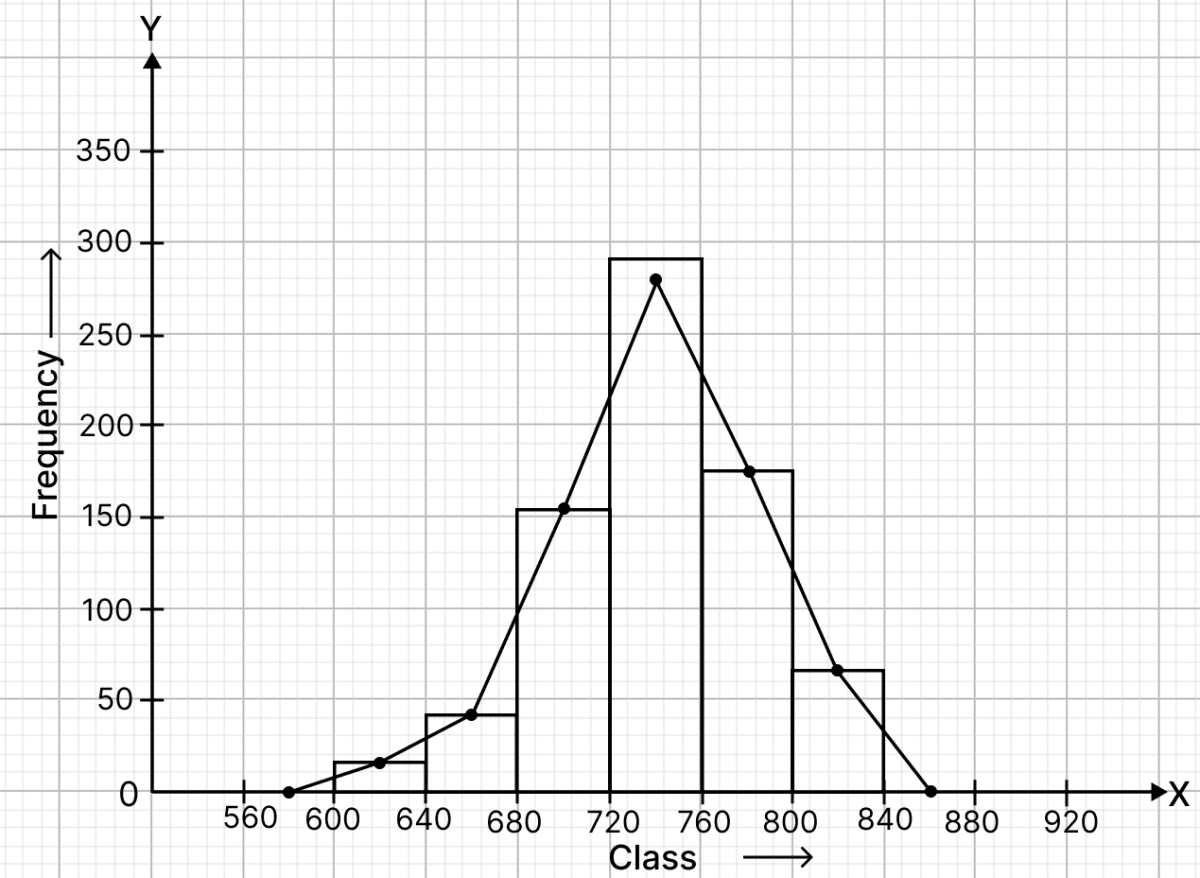
Draw a histogram for the following data:
| Class interval | Frequency |
|---|---|
| 600 - 640 | 18 |
| 640 - 680 | 45 |
| 680 - 720 | 153 |
| 720 - 760 | 288 |
| 760 - 800 | 171 |
| 800 - 840 | 63 |
Using this histogram, draw the frequency polygon on the same graph.
Answer
Frequency distribution table :
| Class interval | Class marks | Frequency |
|---|---|---|
| 600 - 640 | 620 | 18 |
| 640 - 680 | 660 | 45 |
| 680 - 720 | 700 | 153 |
| 720 - 760 | 740 | 288 |
| 760 - 800 | 780 | 171 |
| 800 - 840 | 820 | 63 |
Steps of construction of histogram:
Since, the scale on x-axis starts at 560, a break (kink) is shown near the origin on x-axis to indicate that the graph is drawn to scale beginning at 560.
Take 1 cm along x-axis = 40 units.
Take 1 cm along y-axis = 50 units.
Construct rectangles corresponding to the above continuous frequency distribution table.
Steps of construction of frequency polygon:
Mark the mid-points of upper bases of rectangles of the histogram.
Join the consecutive mid-points by line-segments.
Join first end point with mid-point of class (560 - 600) with zero frequency, and join the other end point with the mid point of class (840 - 880) with zero frequency.
The required frequency polygon is shown by thick line segments in the diagram.
Related Questions
The ages (in years) of 360 patients treated in a hospital on a particular day are given below :
Age in years No. of patients 10 - 20 90 20 - 30 40 30 - 40 60 40 - 50 20 50 - 60 120 60 - 70 30 Draw a histogram and a frequency polygon on the same graph to represent the above data.
Draw a histogram and the frequency polygon from the following data:
Class interval Frequency 20 - 25 30 25 - 30 24 30 - 35 52 35 - 40 28 40 - 45 46 45 - 50 10 Draw an ogive to represent the following data:
Class interval Frequency 400 - 450 16 450 - 500 25 500 - 550 40 550 - 600 32 600 - 650 18 650 - 700 27 700 - 750 9 Draw an ogive for the following frequency distribution:
Marks obtained No. of students Less than 10 8 Less than 20 23 Less than 30 43 Less than 40 50 Less than 50 64