
Mathematics
Draw an ogive for the following frequency distribution :
| Class - interval | Frequency |
|---|---|
| 10 - 19 | 21 |
| 20 - 29 | 15 |
| 30 - 39 | 12 |
| 40 - 49 | 19 |
| 50 - 59 | 8 |
Statistics
2 Likes
Answer
The above frequency distribution is discontinuous, to convert it into continuous frequency distribution,
Subtract the adjustment factor (0.5) from all the lower limits and add the adjustment factor (0.5) to all the upper limits.
Continuous frequency distribution for the given data is :
| Classes before adjustment | Classes after adjustment | Frequency | Cumulative frequency |
|---|---|---|---|
| 10 - 19 | 9.5 - 19.5 | 21 | 21 |
| 20 - 29 | 19.5 - 29.5 | 15 | 36 (21 + 15) |
| 30 - 39 | 29.5 - 39.5 | 12 | 48 (36 + 12) |
| 40 - 49 | 39.5 - 49.5 | 19 | 67 (48 + 19) |
| 50 - 59 | 49.5 - 59.5 | 8 | 75 (67 + 8) |
Steps of construction :
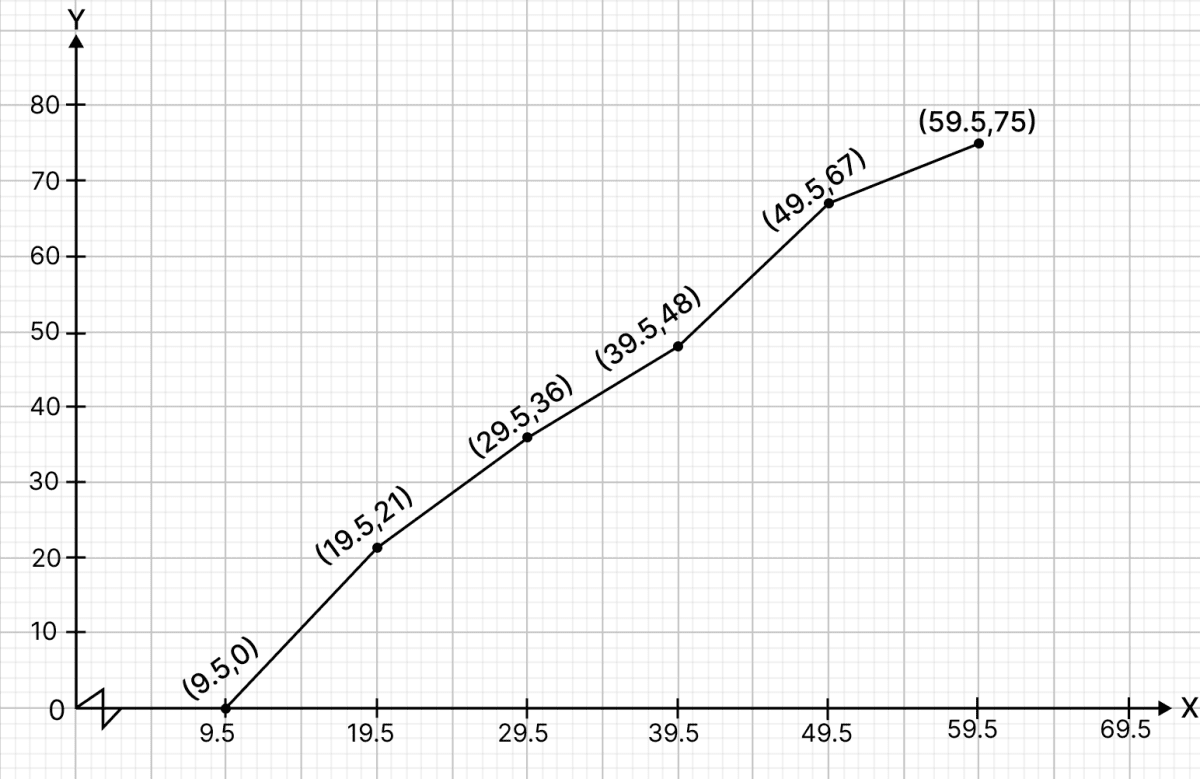
Since, the scale on x-axis starts at 9.5, a break (kink) is shown near the origin on x-axis to indicate that the graph is drawn to scale beginning at 9.5.
Take 2 cm along x-axis = 10 units
Take 1 cm along y-axis = 10 units
Ogive always starts from a point on x-axis representing the lower limit of the first class. Mark point (9.5, 0).
Take upper class limits along x-axis and corresponding cumulative frequencies along y-axis, mark the points (19.5, 21), (29.5, 36), (39.5, 48), (49.5, 67), (59.5, 75).
Join the points marked by a free hand curve.
The required ogive is shown in the below figure:
Answered By
2 Likes
Related Questions
Draw an ogive to represent the following data:
Class interval Frequency 400 - 450 16 450 - 500 25 500 - 550 40 550 - 600 32 600 - 650 18 650 - 700 27 700 - 750 9 Draw an ogive for the following frequency distribution:
Marks obtained No. of students Less than 10 8 Less than 20 23 Less than 30 43 Less than 40 50 Less than 50 64 Draw an ogive for the following data:
Class - interval Frequency 1 - 10 4 11 - 20 6 21 - 30 8 31 - 40 11 41 - 50 7 51 - 60 5 The difference between the class marks of classes 20 - 25 and 45 - 65 is :
30
32.5
35
37.5