Mathematics
Draw an ogive to represent the following data:
| Class interval | Frequency |
|---|---|
| 400 - 450 | 16 |
| 450 - 500 | 25 |
| 500 - 550 | 40 |
| 550 - 600 | 32 |
| 600 - 650 | 18 |
| 650 - 700 | 27 |
| 700 - 750 | 9 |
Answer
The cumulative frequency distribution :
| Class interval | Frequency | Cumulative frequency |
|---|---|---|
| 400 - 450 | 16 | 16 |
| 450 - 500 | 25 | 41 (16 + 25) |
| 500 - 550 | 40 | 81 (41 + 40) |
| 550 - 600 | 32 | 113 (81 + 32) |
| 600 - 650 | 18 | 131 (113 + 18) |
| 650 - 700 | 27 | 158 (131 + 27) |
| 700 - 750 | 9 | 167 (158 + 9) |
Steps of construction of ogive:
Take 2 cm = 50 units along x-axis.
Take 1 cm = 25 units along y-axis.
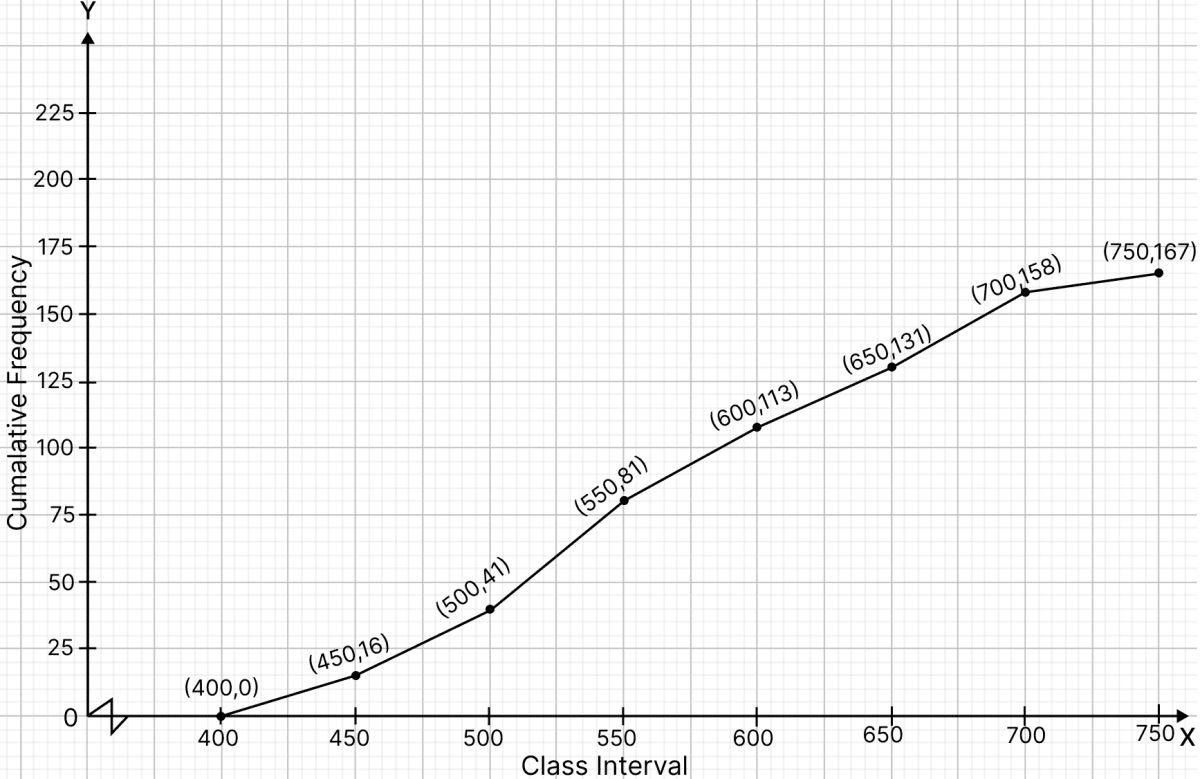
Ogive always starts from a point on x-axis representing the lower limit of the first class. Mark point (400, 0).
Take upper class limits along x-axis and corresponding cumulative frequencies along y-axis, mark the points (450, 16), (500, 41), (550, 81), (600, 113), (650, 131), (700, 158) and (750, 167).
Join the points marked by a free hand curve.
The required ogive is shown in the below figure:
Related Questions
Draw a histogram and the frequency polygon from the following data:
Class interval Frequency 20 - 25 30 25 - 30 24 30 - 35 52 35 - 40 28 40 - 45 46 45 - 50 10 Draw a histogram for the following data:
Class interval Frequency 600 - 640 18 640 - 680 45 680 - 720 153 720 - 760 288 760 - 800 171 800 - 840 63 Using this histogram, draw the frequency polygon on the same graph.
Draw an ogive for the following frequency distribution:
Marks obtained No. of students Less than 10 8 Less than 20 23 Less than 30 43 Less than 40 50 Less than 50 64 Draw an ogive for the following frequency distribution :
Class - interval Frequency 10 - 19 21 20 - 29 15 30 - 39 12 40 - 49 19 50 - 59 8