
Mathematics
By drawing a graph for each of the equations 3x + y + 5 = 0; 3y - x = 5 and 2x + 5y = 1 on the same graph paper; show that the lines given by these equations are concurrent (i.e. they pass through the same point).
Take 2 cm = 1 unit on both the axes.
Graphical Solution
15 Likes
Answer
First equation: 3x + y + 5 = 0
Step 1:
Give at least three suitable values to the variable x and find the corresponding values of y.
Let x = -3, then 3 (-3) + y + 5 = 0 ⇒ y = 4
Let x = -2, then 3 (-2) + y + 5 = 0 ⇒ y = 1
Let x = 1, then 3 1 + y + 5 = 0 ⇒ y = -8
Step 2:
Make a table (as given below) for the different pairs of the values of x and y:
| x | -3 | -2 | 1 |
|---|---|---|---|
| y | 4 | 1 | -8 |
Step 3:
Plot the points, from the table, on a graph paper and then draw a straight line passing through the points plotted on the graph.
Second equation: 3y - x = 5
Step 1:
Give at least three suitable values to the variable x and find the corresponding values of y.
Let x = -2, then 3y - (-2) = 5 ⇒ y = 1
Let x = 1, then 3y - 1 = 5 ⇒ y = 2
Let x = 7, then 3y - 7 = 5 ⇒ y = 4
Step 2:
Make a table (as given below) for the different pairs of the values of x and y:
| x | -2 | 1 | 7 |
|---|---|---|---|
| y | 1 | 2 | 4 |
Step 3:
Plot the points, from the table, on a graph paper and then draw a straight line passing through the points plotted on the graph.
Third equation: 2x + 5y = 1
Step 1:
Give at least three suitable values to the variable x and find the corresponding values of y.
Let x = -7, then 2 (-7) + 5y = 1 ⇒ y = 3
Let x = -2, then 2 (-2) + 5y = 1 ⇒ y = 1
Let x = 3, then 2 3 + 5y = 1 ⇒ y = -1
Step 2:
Make a table (as given below) for the different pairs of the values of x and y:
| x | -7 | -2 | 3 |
|---|---|---|---|
| y | 3 | 1 | -1 |
Step 3:
Plot the points, from the table, on a graph paper and then draw a straight line passing through the points plotted on the graph. 3
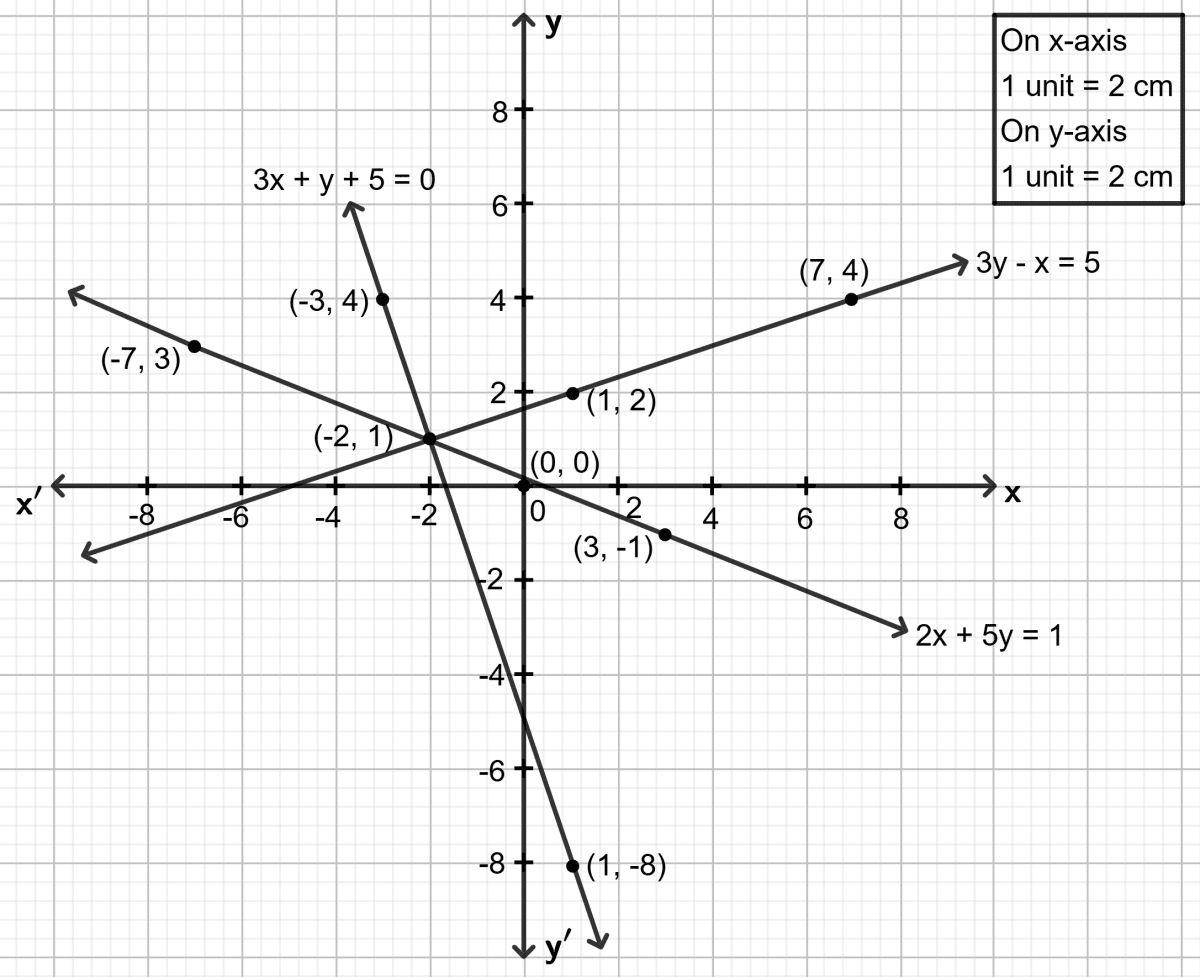
From the graph, it is clear that all three lines intersect at a common point (-2, 1), confirming that the lines are concurrent.
Answered By
7 Likes
Related Questions
Use graph paper for this question. Take 2 cm = 1 unit on both the axes.
(i) Draw the graphs of x + y + 3 = 0 and 3x - 2y + 4 = 0. Plot only three points per line.
(ii) Write down the co-ordinates of the point of intersection of the lines.
(iii) Measure and record the distance of the point of intersection of the lines from the origin in cm.
The sides of a triangle are given by the equations y - 2 = 0; y + 1 = 3 (x - 2) and x + 2y = 0.
Find, graphically :
(i) the area of triangle;
(ii) the co-ordinates of the vertices of the triangle.
Using a scale of 1 cm to 1 unit for both the axes, draw the graphs of the following equations : 6y = 5x + 10, y = 5x - 15.
From the graph find :
(i) the co-ordinates of the point where the two lines intersect;
(ii) the area of the triangle between the lines and the x-axis.
The cost of manufacturing x articles is ₹ (50 + 3x). The selling price of x articles is ₹ 4x.
On a graph sheet, with the same axes, and taking suitable scales draw two graphs, first for the cost of manufacturing against no. of articles and the second for the selling price against number of articles.
Use your graph to determine :
(i) No. of articles to be manufactured and sold to breakeven (no profit and no loss),
(ii) The profit or loss made when
(a) 30 (b) 60 articles are manufactured and sold.