
Robotics & Artificial Intelligence
Explore the Pandas library to read the data that is available in .csv or .xlsx files. Plot the data with the help of Matplotlib.
Python Modules
1 Like
Answer
The Pandas library is used to read data from .csv files, and the Matplotlib library is used to plot the data.
# data.csv

X,Y
1,2
2,4
3,6
4,8
5,10
Program
import pandas as pd
import matplotlib.pyplot as plt
data = pd.read_csv("data.csv")
plt.plot(data['X'], data['Y'])
plt.xlabel('X')
plt.ylabel('Y')
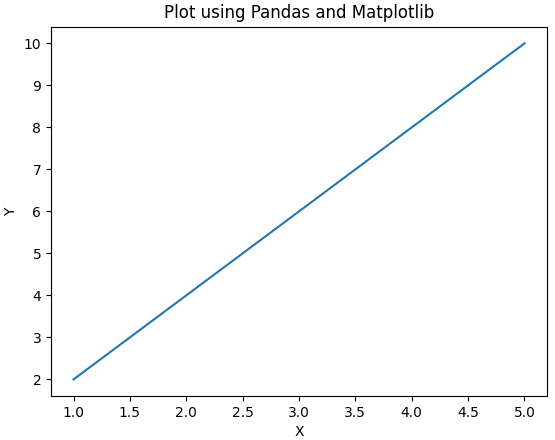
plt.title('Plot using Pandas and Matplotlib')
plt.show()
Output
Answered By
3 Likes
Related Questions
Create a Python package and one module under it. Write Python code to use this package.
Explain any four functions of the Matplotlib library.
Write a Python program to solve the following linear equations:
2x + y = 5
x + 3y = 8Explore the Matplotlib library for plotting bar charts, line charts and pi charts.