
Robotics & Artificial Intelligence
Which of the following data visualisation techniques is depicted in this image?
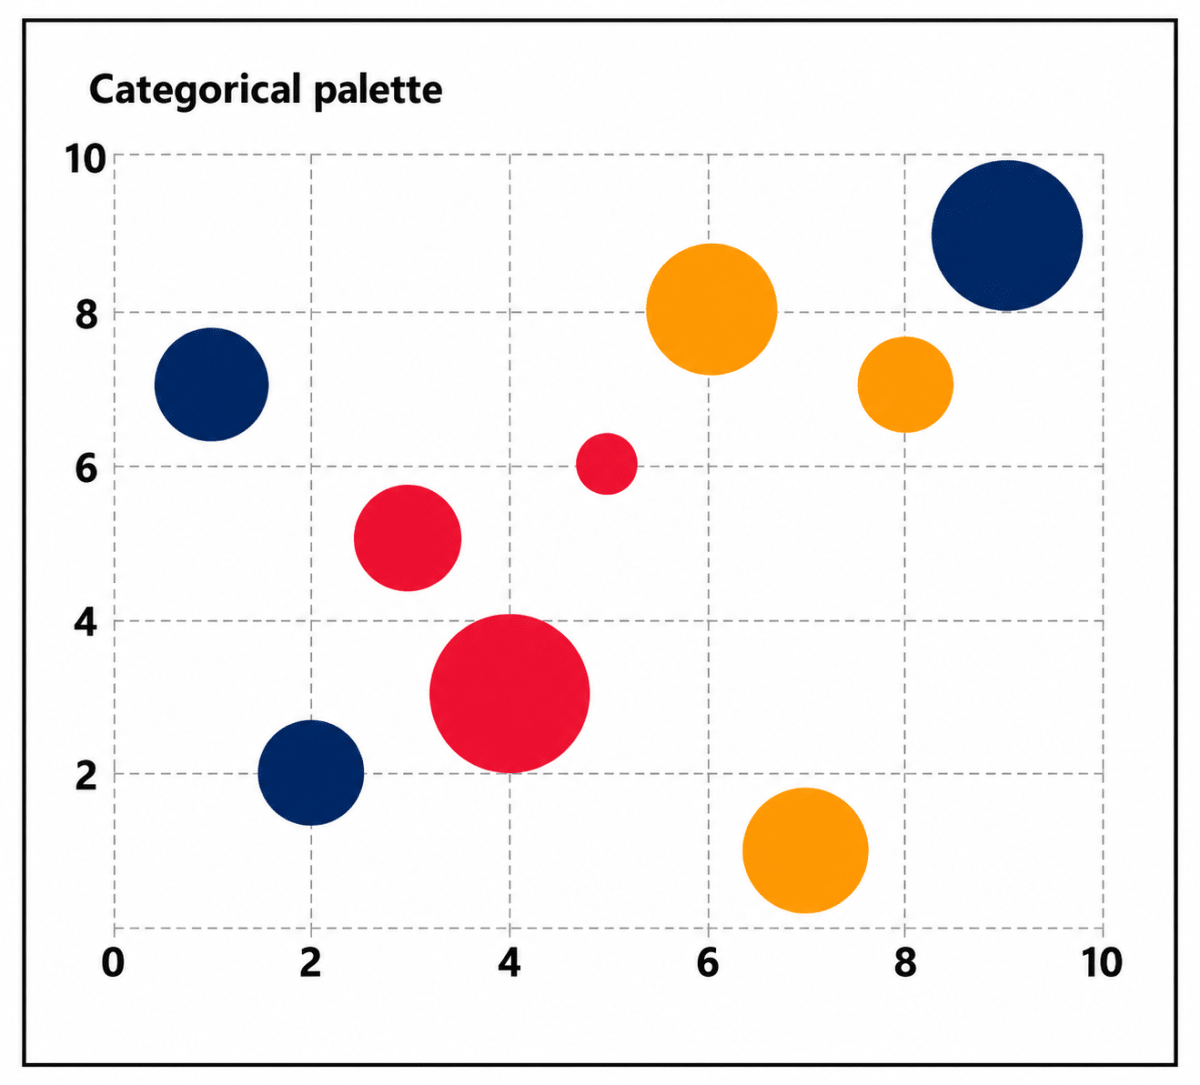
- Scatter Plot
- Fizz Plot
- Ball Plot
- Bubble Plot
AI Concepts
3 Likes
Answer
Bubble Plot
Reason — The image depicts a Bubble Plot, which is a sophisticated data visualisation tool that displays three dimensions of data simultaneously. Each point's position is determined by two variables on the x and y axes, while the size of the bubble represents a third variable.
Answered By
2 Likes
Related Questions
What is the first stage in the AI Project Cycle?
- Data Acquisition
- Data Exploration
- Problem Scoping
- Modelling
Which stage involves gathering relevant data for the project?
- Problem Scoping
- Data Acquisition
- Modelling
- Evaluation
Which of the following is NOT a step in the AI Project Cycle?
- Evaluation
- Data Cleaning
- Problem Scoping
- Data Acquisition
Which of the following does not belong to the components of 4Ws Canvas?
- Who
- Where
- What
- When