
Mathematics
The following distribution gives the daily wages of 60 workers of a factory.
| Daily Income (in ₹) | Number of Workers (f) |
|---|---|
| 200 - 300 | 6 |
| 300 - 400 | 10 |
| 400 - 500 | 14 |
| 500 - 600 | 16 |
| 600 - 700 | 10 |
| 700 - 800 | 4 |
Use graph paper to answer this question.
Take 2 cm = ₹ 100 along one axis and 2 cm = 2 workers along the other axis. Draw a histogram and hence find the mode of the given distribution.
Measures of Central Tendency
1 Like
Answer
Steps of construction :
Draw a histogram of the given distribution.
Inside the highest rectangle, which represents the maximum frequency (or modal class), draw two lines AC and BD diagonally from the upper corners C and D of adjacent rectangles.
Through the point K (the point of intersection of diagonals AC and BD), draw KL perpendicular to the horizontal axis.
The value of point L on the horizontal axis represents the value of mode.
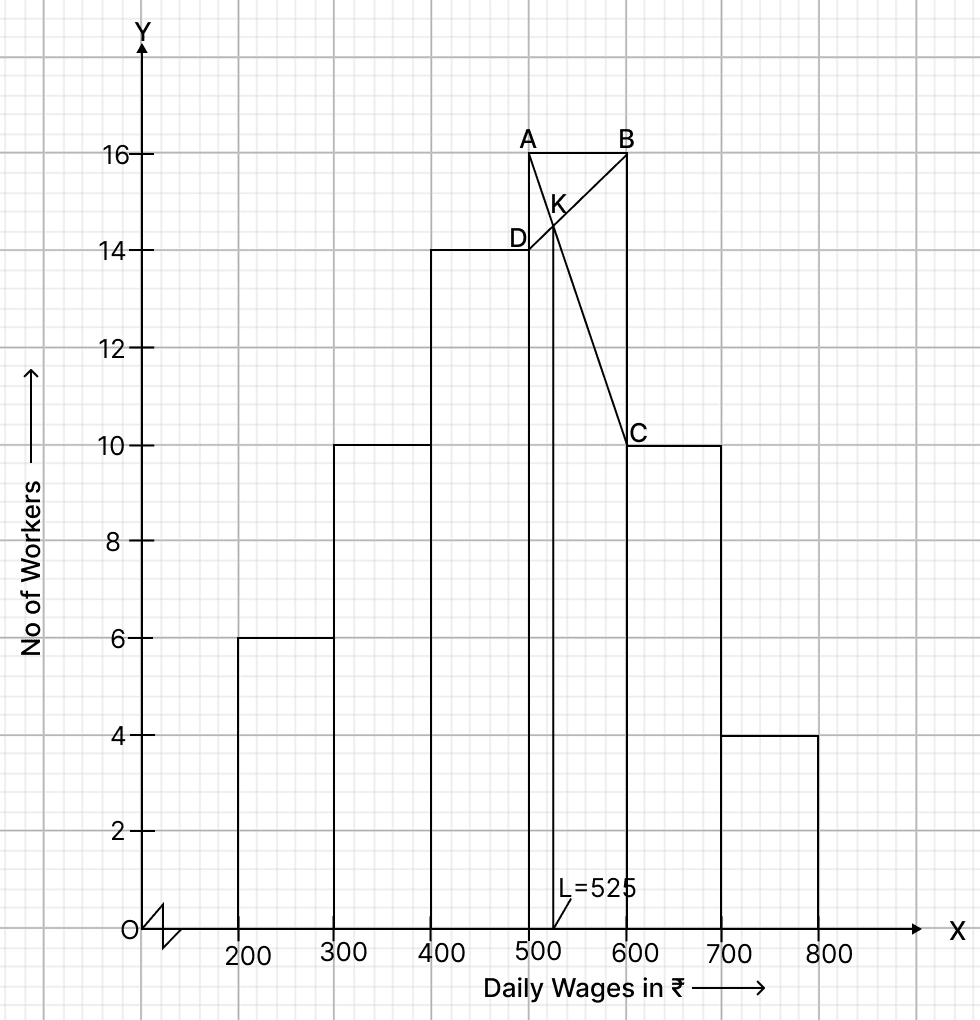
From graph,
L = ₹ 525
Hence, required mode = ₹ 525.
Answered By
2 Likes
Related Questions
Draw a histogram for the given data, using a graph paper:
Weekly Wages (in ₹) No. of people 3000 - 4000 4 4000 - 5000 9 5000 - 6000 18 6000 - 7000 6 7000 - 8000 7 8000 - 9000 2 9000 - 10000 4 Estimate the mode from the graph.
Marks obtained by 100 students in an examination are given below:
Marks No. of students 0 - 10 5 10 - 20 15 20 - 30 20 30 - 40 28 40 - 50 20 50 - 60 12 Draw a histogram for the given data using a graph paper and find the mode. Take 2 cm = 10 marks along one axis and 2 cm = 10 students along the other axis.
A data has 35 observations arranged in a descending order. Which organization represents the median?
16th
17th
18th
19th
The median of first 8 prime numbers is:
7
9
11
13