
Mathematics
The following table shows the weights (in gm) of a sample of 100 apples, taken from a large consignment:
| Weight (in gm) | Number of apples |
|---|---|
| 50 - 60 | 8 |
| 60 - 70 | 10 |
| 70 - 80 | 12 |
| 80 - 90 | 16 |
| 90 - 100 | 18 |
| 100 - 110 | 14 |
| 110 - 120 | 12 |
| 120 - 130 | 10 |
(i) Construct the cumulative frequency table
(ii) Draw the cumulative frequency curve on a graph paper and from it, determine the median weight of the apples.
Measures of Central Tendency
2 Likes
Answer
(i) The cumulative frequency distribution table is as follows:
| Weight (in gm) | Number of apples | Cumulative frequency |
|---|---|---|
| 50 - 60 | 8 | 8 |
| 60 - 70 | 10 | 18 (10 + 8) |
| 70 - 80 | 12 | 30 (18 + 12) |
| 80 - 90 | 16 | 46 (30 + 16) |
| 90 - 100 | 18 | 64 (46 + 18) |
| 100 - 110 | 14 | 78 (64 + 14) |
| 110 - 120 | 12 | 90 (78 + 12) |
| 120 - 130 | 10 | 100 (90 + 10) |
(ii) Steps of construction :
Take 1 cm along x- axis = 10 grams
Take 1 cm along y- axis = 10 units
A kink is drawn near x-axis to show that the scale starts from 50 and not zero. Plot the point (50, 0) as ogive starts from x- axis representing lower limit of first class.
Plot the points (60, 8), (70, 18), (80, 30), (90, 46), (100, 64), (110, 78), (120, 90), (130, 100)
Joint the points by a free hand curve.
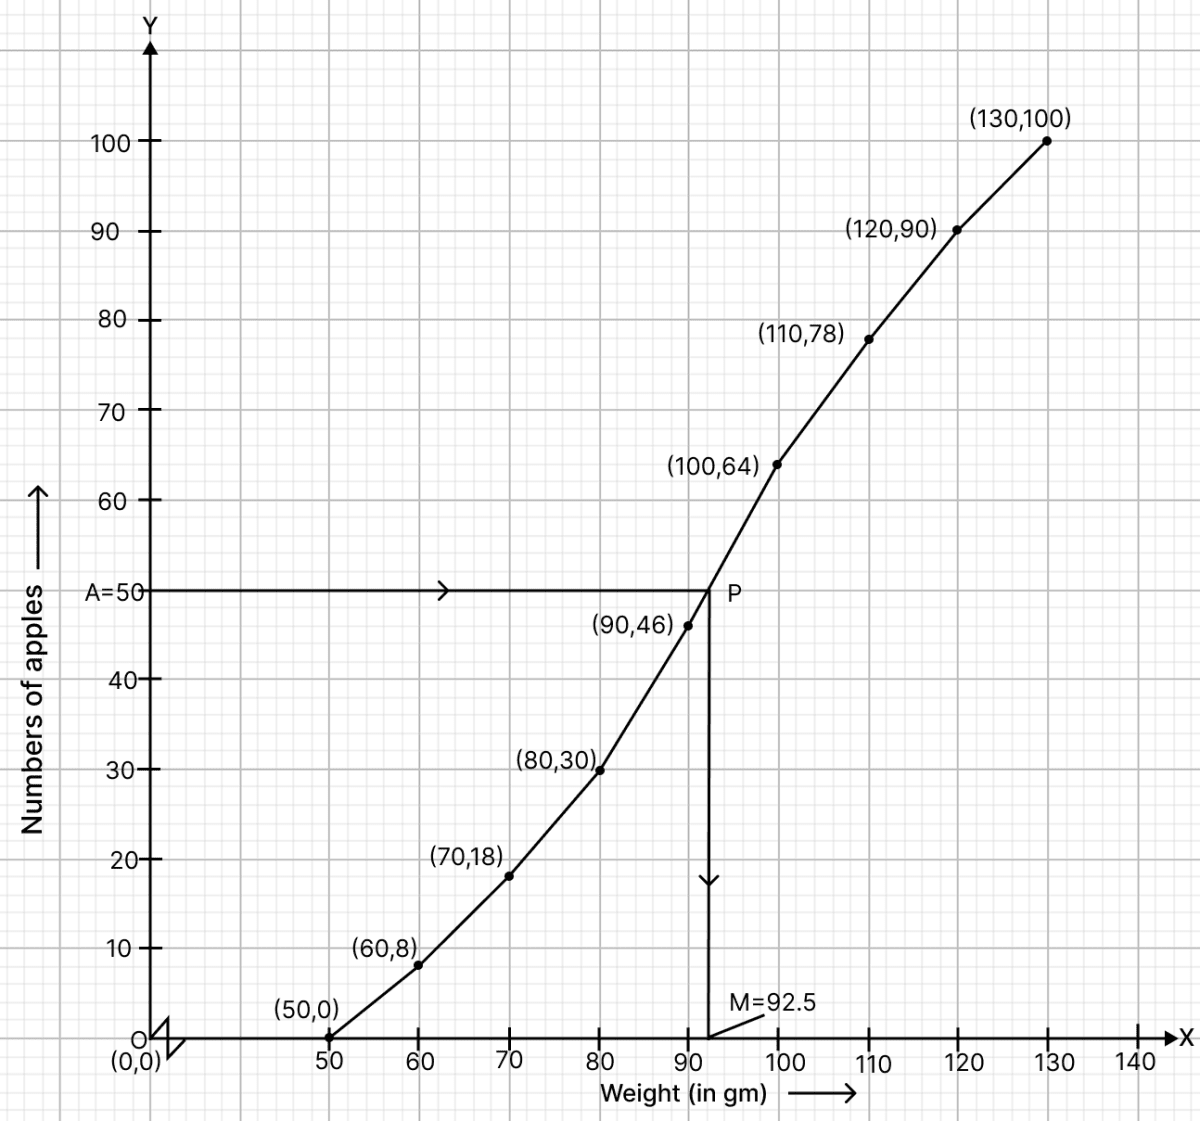
Here, n (no, of students) = 100.
To find the median :
Let A be the point on y-axis representing frequency = = 50.
Through A draw a horizontal line to meet the ogive at P. Through P, draw a vertical line to meet the x-axis at M. The abscissa of the points M represents 92.5.
Hence, the median weight is 92.5 gm.
Answered By
1 Like
Related Questions
The heights (in nearest cm) of 63 students of a certain school are given in the following frequency distribution table:
Height (in cm) Number of students 150 9 151 12 152 10 153 8 154 11 155 7 156 6 Find :
(i) Median
(ii) Lower quartile (Q1)
(iii) Upper quartile (Q3)
(iv) Interquartile range from the above data.
From the following frequency distribution find :
(i) Median
(ii) Lower quartile (Q1)
(iii) Upper quartile (Q3)
(iv) Interquartile range
Variate Frequency 26 6 25 4 18 8 16 9 30 5 28 11 20 13 23 4 Marks obtained by 200 students in an examination are given below:
Marks Number of students 0 - 10 5 10 - 20 11 20 - 30 10 30 - 40 20 40 - 50 28 50 - 60 37 60 - 70 40 70 - 80 29 80 - 90 14 90 - 100 6 Draw an ogive for the given distribution taking 1 cm = 10 marks on one axis and 2 cm = 20 students on other axis.
Using the graph, determine :
(i) The median marks
(ii) The number of students who failed, if minimum marks required to pass is 40.
(iii) If scoring 85 and more marks is considered as grade one, find the number of students who secured grade one in the examination.
Marks obtained by 200 students in an examination are given below:
Marks Number of students 0 - 10 5 10 - 20 10 20 - 30 14 30 - 40 21 40 - 50 25 50 - 60 34 60 - 70 36 70 - 80 27 80 - 90 16 90 - 100 12 Draw an ogive for the given distribution taking 2 cm = 10 marks on one axis and 2 cm = 20 students on other axis. From the graph, find:
(i) the median
(ii) the upper-quartile
(iii) number of students scoring more than 65 marks
(iv) if 10 students qualify for merit-scholarship, find the minimum marks required to qualify.