Mathematics
The given graph with a histogram represents the number of plants of different heights grown in a school campus. Study the graph carefully and answer the following questions :
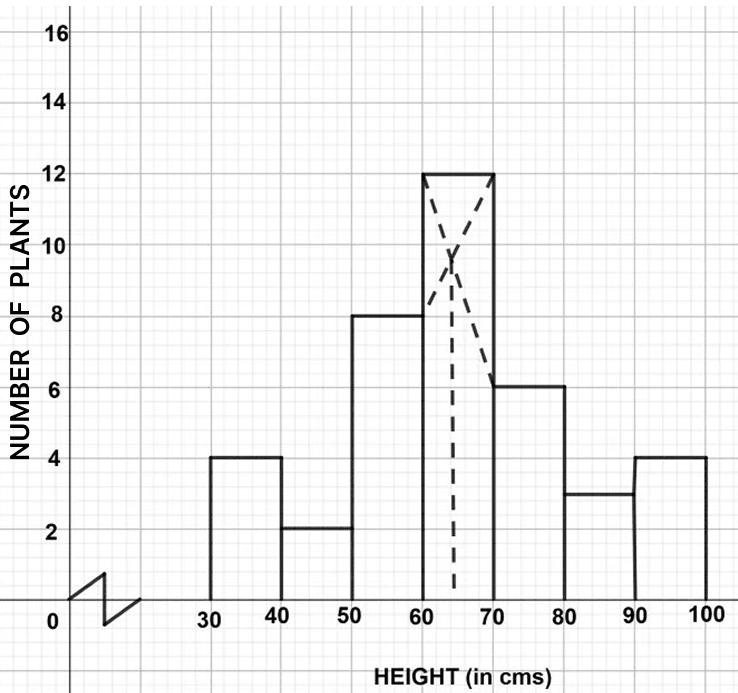
(a) Make a frequency table with respect to the class boundaries and their corresponding frequencies.
(b) State the modal class.
(c) Identify and note down the mode of the distribution.
(d) Find the number of plants whose height range is between 80 cm to 90 cm.
Related Questions
The following table gives the duration of movies in minutes.
Duration (in minutes) No. of movies 100-110 5 110-120 10 120-130 17 130-140 8 140-150 6 150-160 4 Using step–deviation method, find the mean duration of the movies.
The angles of elevation of the top of a 100 m high tree from two points A and B on the opposite side of the tree are 52° and 45° respectively. Find the distance AB, to the nearest metre.

Solve the following quadratic equation for x and give your answer correct to three significant figures :
2x2 - 10x + 5 = 0