Physics
The given graph represents the cooling curve of a liquid.
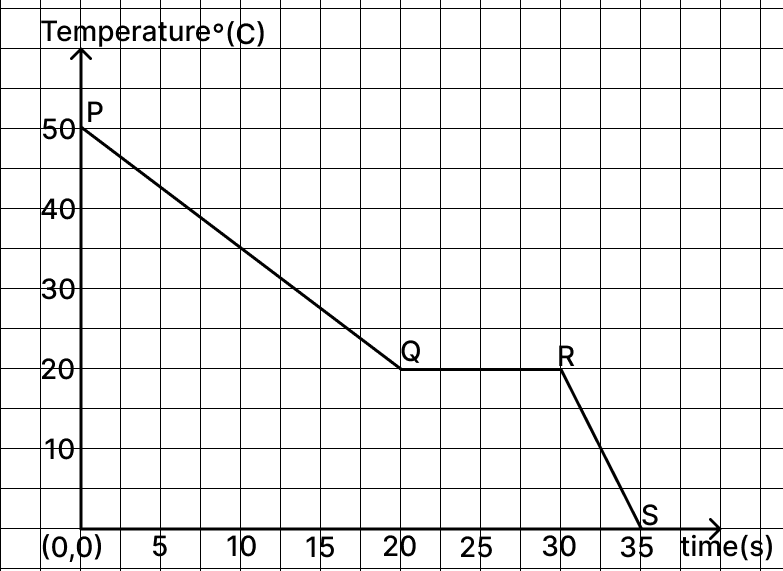
(a) State the freezing temperature of the liquid.
(b) Name the phase change happening at the region QR.
(c) In which state (solid / liquid) does the above substance liberate heat at a faster rate? Justify.
Answer
(a) The freezing temperature of the liquid is 20 °C because at this temperature, the graph becomes horizontal, indicating that the temperature remains constant during the phase change.
(b) In the region QR, the phase change taking place is freezing (liquid changing into solid).
(c) The substance liberates heat at a faster rate in the solid state which is shown by the steeper slope of the graph after point R, indicating a faster decrease in temperature compared to the liquid state before point Q, where the slope is less steep.
Related Questions
An object placed in front of a convex lens, forms an image of same size on a screen. Moving the object 12 cm closer to the lens results in the formation of a real image which is three times the size of the object. Calculate the focal length of the lens.
(a) Atmospheric temperature after a hailstorm is greater than the temperature during the hailstorm. State True or False.
(b) Which thermal physical quantity of a frying pan changes by making its base heavier?
(c) State the principle of Calorimetry.
The diagram shows a wheel with a handle. Two forces, F1 and F2 of equal magnitudes are acting on the handle as shown in the diagram.
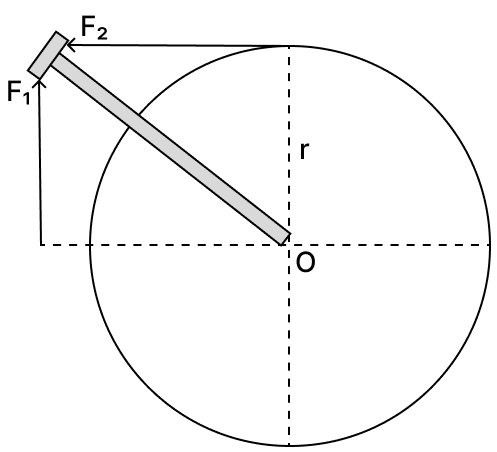
(a) Which force produces negative moment?
(b) Is the wheel in equilibrium? (Yes or No)
(c) Justify your answer stated in (b).
(a) Name the unit of work done, used in subatomic scale.
(b) To which class of lever does a pair of scissors belong?
(c) A stone is tied to a string and displaced from A to B by application of constant force F in three different ways as shown in the diagram below.
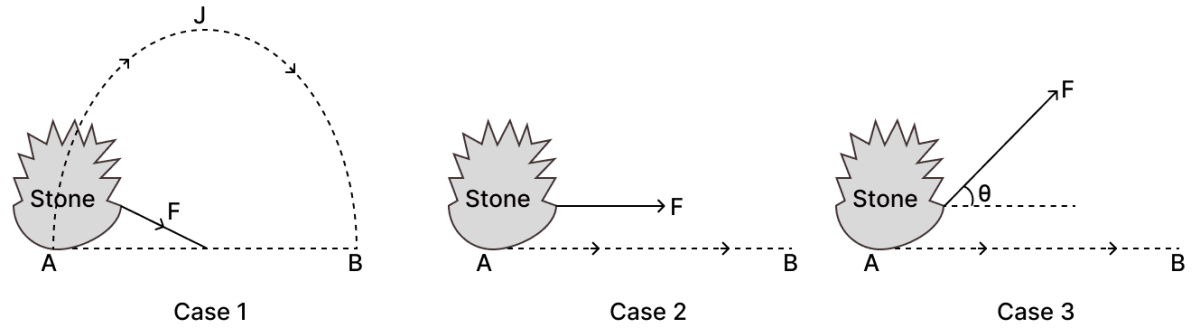
Arrange the three cases in ascending order of the work done by the force. (Given AJB is a semi-circle, θ < 90° and AB = 20 m)