Mathematics
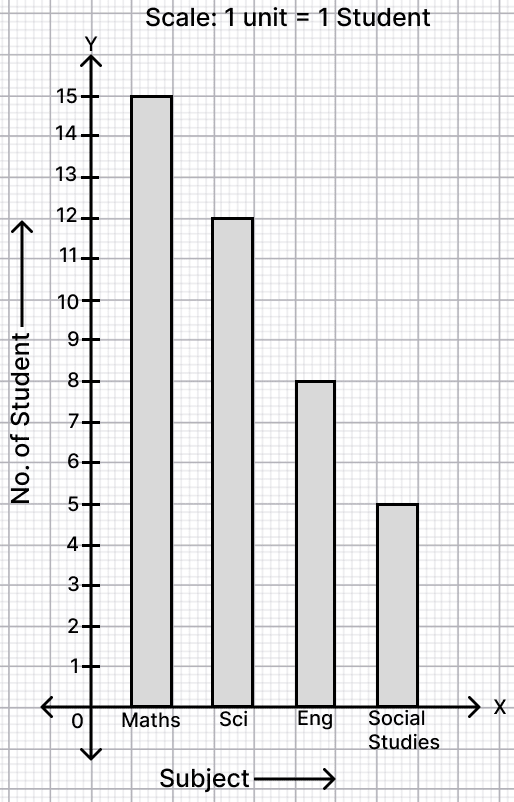
A group of 40 students were asked their favourite subject. The replies were: 15 liked Mathematics, 12 liked Science, 8 liked English and the rest liked Social Studies. Draw a bar graph representing this data.
Answer
Given,
Number of students who liked Social Studies = 40 - (15 + 12 + 8) = 40 - 35 = 5.
The data to be represented is:
| Subject | Number of students |
|---|---|
| Mathematics | 15 |
| Science | 12 |
| English | 8 |
| Social Studies | 5 |
Taking the subjects on the horizontal axis and the number of students on the vertical axis (scale: 1 unit = 1 student), the bar graph is drawn with bars of equal width and equal spacing.
Related Questions
Draw a line segment AB = 7.5 cm. Construct a perpendicular at point A using compass and ruler.
Classify the following angles as acute, obtuse, right, straight or reflex:
(a) 35° (b) 90° (c) 125° (d) 180° (e) 280°
Rani has 36 red balloons and 48 yellow balloons. She wants to make balloon bunches using the same number of each colour in every bunch, with no balloons left over.
(a) What is the greatest number of bunches she can make?
(b) How many red and yellow balloons will be in each bunch?
The floor of a rectangular room is 6 m long and 4 m wide. Tiles of size 30 cm × 20 cm are to be laid on it.
(a) What is the area of the floor?
(b) What is the area of one tile?
(c) How many tiles will be required to cover the entire floor?