
Mathematics
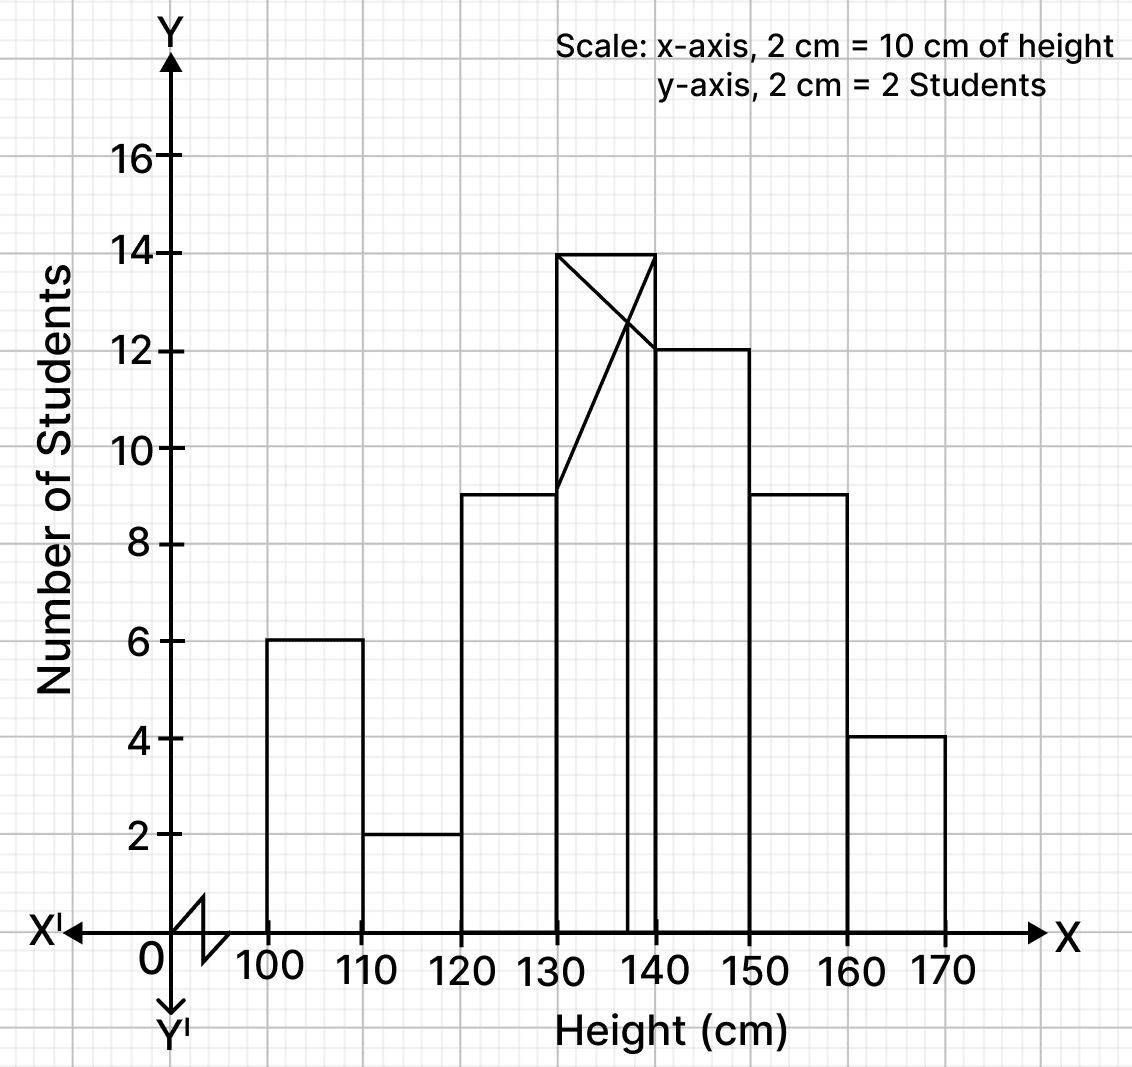
The histogram drawn on the graph represents the number of students of different heights (in cm).
Using the graph, answer the following :
(a) the number of students whose height is 150 cm and above.
(b) the modal height.
(c) the total number of students.
Mensuration
2 Likes
Answer
(a) From graph,
Students whose height is 150 cm and above :
150 - 160 = 9 students
160 - 170 = 4 students
Total number of students whose height is 150 cm and above = 9 + 4 = 13
Hence, number of students whose height is 150 cm and above = 13.
(b) From graph,
The vertical line intersects the x-axis at 137.
Hence, the modal height = 137 cm.
(c) Total number of students = 6 + 2 + 9 + 14 + 12 + 9 + 4 = 56.
Hence, total number of students = 56.
Answered By
1 Like
Related Questions
The cost price of a TV set is ₹ 20,000. The shopkeeper marked it for ₹ 24,000. He sells it to a customer at a discount of 10% on the marked price. If the sale is intra-state and the rate of GST is 12%, find the:
(a) discounted price of the TV set.
(b) amount paid by the customer to clear the bill.
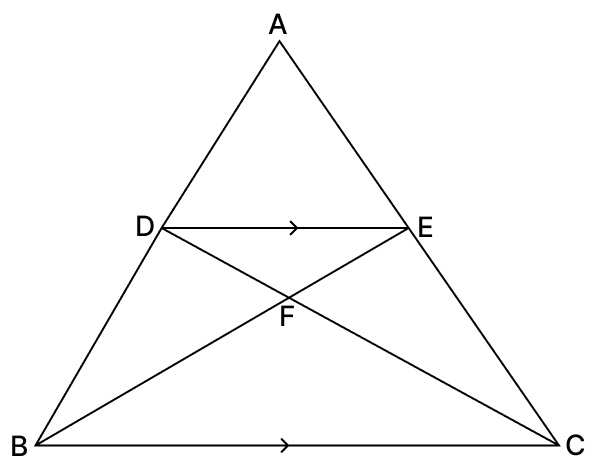
In the given diagram, DE || BC and AD : DB = 2 : 3.
(a) Prove that : ΔADE ~ ΔABC and hence find DE : BC.
(b) Prove : ΔDFE ~ ΔCFB
(c) Given, area of ΔDFE = 16 square units, find the area of ΔCFB.
A(−10, −2) and B(2, 10) are two end points of a line segment. If AB intersects the x-axis at P, find the :
(a) ratio in which ‘P’ divides AB.
(b) coordinates of point P.
Solve the quadratic equation (x − 2)2 − 5x − 3 = 0 and give your answer correct to 3 significant figures.