
Mathematics
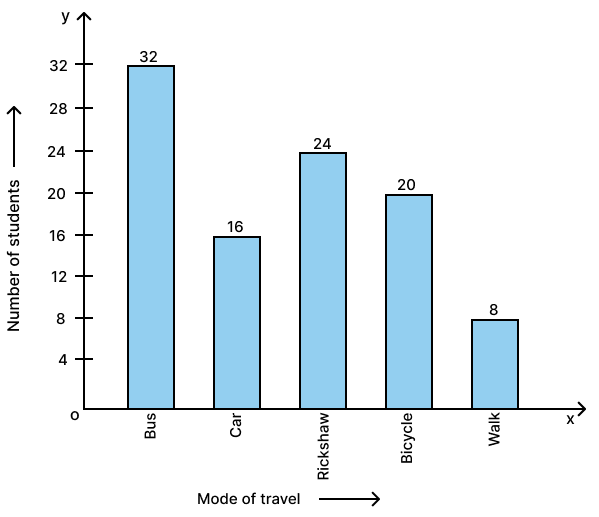
Hundred students from a certain locality use different modes of traveling to school as given below. Draw a bar graph.
| Bus | Car | Rickshaw | Bicycle | Walk |
|---|---|---|---|---|
| 32 | 16 | 24 | 20 | 8 |
Statistics
17 Likes
Answer
Steps:
On a graph paper, draw two mutually perpendicular lines OX and OY which intersect each other at point O.
The line OX is taken horizontal and is called the x-axis, whereas the line OY is taken vertical and is called the y-axis.
On the x-axis, starting from O, mark points at equal distances. At these points write the names of different modes of travel given. In this question, the names are Bus, Car, Rickshaw, Bicycle and Walk.
Along y-axis, mark the heights of the bars (rectangles) in proportion to the given data (number of students).
Remember:
(i) The heights of different bars (rectangles) are parallel to y-axis and the mid-points of their bases are on the points marked on the x-axis (step 2).
(ii) The bars may be taken of any suitable width, but widths of all the bars must be the same.
(iii) The space (distance) between consecutive bars may be of any suitable value, but the spaces between all the consecutive bars must be the same.
The required bar graph is as given below:
Answered By
14 Likes
Related Questions
In a pie-chart, an angle of 30° represents 80 articles. The number of articles represented by 105° are :
280
200
none of these
In a pie-chart, 76 articles are represented by 19°; how many articles will be represented by 76° ?
19
76
304
none of these
Mr. Mirza's monthly income is ₹ 7,200. He spends ₹ 1,800 on rent, ₹ 2,700 on food, ₹ 900 on education of his children, ₹ 1,200 on other things and saves the rest.
Draw a pie-chart to represent it.
The percentage of marks obtained in different subjects by Ashok Sharma (in an examination) are given below. Draw a bar graph to represent it.
English Hindi Maths Science Social Studies 85 60 35 50 70