
Robotics & Artificial Intelligence
Identify the type of graph shown below.
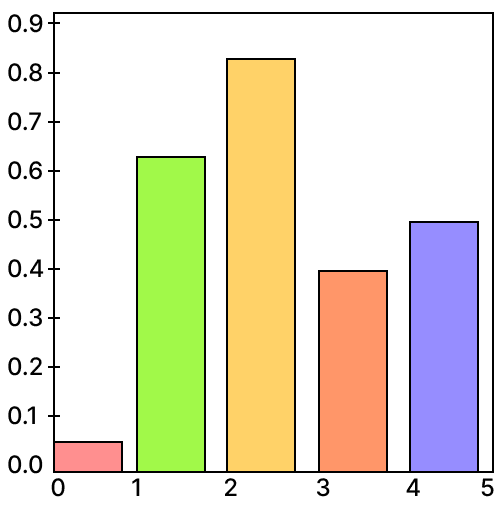
- Line graph
- Pie plot
- Bar graph
- Scatter plot
Python Modules
1 Like
Answer
Bar graph
Reason — The given figure represents a bar graph, where data values are shown using rectangular bars of equal width, and the height of each bar corresponds to the value of the data.
Answered By
2 Likes
Related Questions
Who proposed the Turing test?
- Allen Turing
- Charles Babbage
- John won Newman
- Isaac Newton
What will be the output of the code given below?
st = "This is a test String" v = st.count("s") print(v)- 1
- 2
- 3
- 4
Which one of the following is a single board computer?
- Raspberry Pi
- TensorFlow
- PyTorch
- Media center
Give the output of the following Python code.
my_list = [1, 2, 3, 4] my_list.append(5) my_list.insert(2, 10) print(my_list)- [1, 2, 3, 4, 5, 10]
- [1, 10, 2, 3, 4, 5]
- [1, 2, 10, 3, 4, 5]
- [1, 2, 3, 10, 4, 5]