Robotics & Artificial Intelligence
Identify the type of graph shown below:
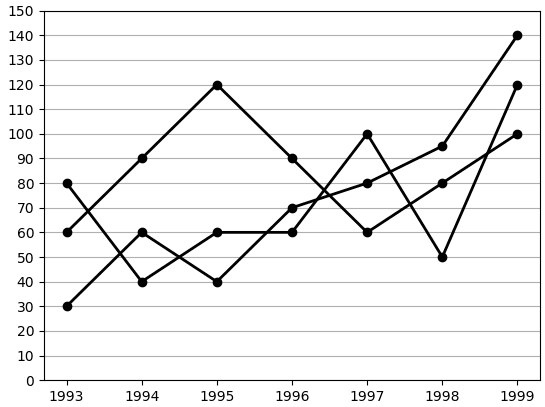
- Scatter plot
- Bar graph
- Pie chart
- Line graph
Related Questions
…………… software is used to simulate a robotic system.
- LibreOffice
- MS Word
- Tinkercad
- MySQL
Assertion (A): Robots use actuators for movement.
Reason (R): Actuators sense the environment and convert it to electrical signals.
- (A) is true but (R) is false.
- (A) is false but (R) is true.
- Both (A) and (R) are true and (R) is the correct explanation for (A).
- Both (A) and (R) are true but (R) is not the correct explanation for (A).
In AI problem scoping, "Who" refers to the:
- dataset used for training.
- end users affected by the project.
- programming environment used.
- hardware requirements of the project.
Give the output of the following Python code:
msg = "Artificial Intelligence" print(msg[11:14])- tel
- Int
- ell
- gen