
Mathematics
Marks obtained by 100 students in an examination are given below:
| Marks | No. of students |
|---|---|
| 0 - 10 | 5 |
| 10 - 20 | 15 |
| 20 - 30 | 20 |
| 30 - 40 | 28 |
| 40 - 50 | 20 |
| 50 - 60 | 12 |
Draw a histogram for the given data using a graph paper and find the mode. Take 2 cm = 10 marks along one axis and 2 cm = 10 students along the other axis.
Measures of Central Tendency
5 Likes
Answer
Steps :
Take 2 cm along x-axis = 10 marks and 2 cm along y-axis = 10 students (frequency).
Construct rectangles corresponding to the given data.
In highest rectangle, draw two straight lines AC and BD from corners of the rectangles on either side of the highest rectangle to the opposite corners of the highest rectangle. Let P be the point of intersection of AC and BD.
Through P, draw a vertical line to meet the x-axis at M. The abscissa of the point M represents 35.
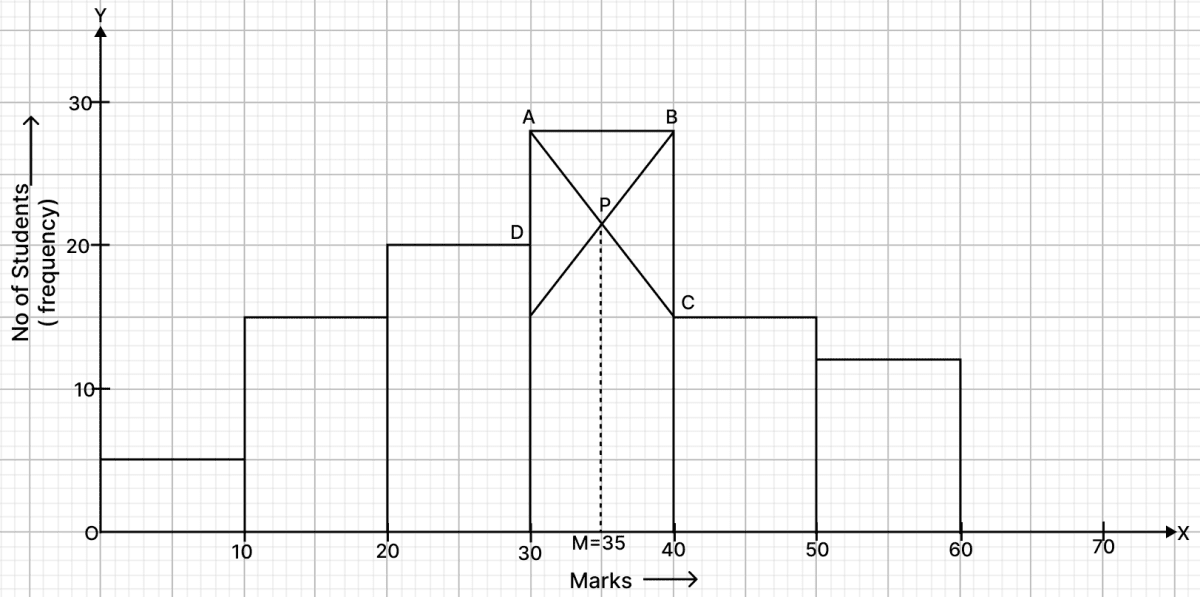
Hence, the required mode = 35.
Answered By
2 Likes
Related Questions
Using a graph paper, draw a histogram for the given distribution showing the number of runs scored by 50 batsmen. From the histogram, estimate the mode of the data:
Runs scored No. of batsmen 3000 - 4000 4 4000 - 5000 18 5000 - 6000 9 6000 - 7000 6 7000 - 8000 7 8000 - 9000 2 9000 - 10000 4 Draw a histogram for the given data, using a graph paper:
Weekly Wages (in ₹) No. of people 3000 - 4000 4 4000 - 5000 9 5000 - 6000 18 6000 - 7000 6 7000 - 8000 7 8000 - 9000 2 9000 - 10000 4 Estimate the mode from the graph.
The following distribution gives the daily wages of 60 workers of a factory.
Daily Income (in ₹) Number of Workers (f) 200 - 300 6 300 - 400 10 400 - 500 14 500 - 600 16 600 - 700 10 700 - 800 4 Use graph paper to answer this question.
Take 2 cm = ₹ 100 along one axis and 2 cm = 2 workers along the other axis. Draw a histogram and hence find the mode of the given distribution.
A data has 35 observations arranged in a descending order. Which organization represents the median?
16th
17th
18th
19th