
Mathematics
Marks obtained by 200 students in an examination are given below :
| Marks | No. of students |
|---|---|
| 0 - 10 | 5 |
| 10 - 20 | 11 |
| 20 - 30 | 10 |
| 30 - 40 | 20 |
| 40 - 50 | 28 |
| 50 - 60 | 37 |
| 60 - 70 | 40 |
| 70 - 80 | 29 |
| 80 - 90 | 14 |
| 90 - 100 | 6 |
Draw an ogive for the given distribution taking 2 cm = 10 marks on one axis and 2 cm = 20 students on the other axis. Using the graph, determine :
(i) The median marks
(ii) The number of students who failed if minimum marks required to pass is 40.
(iii) If scoring 85 and more marks is considered as grade one, find the number of students who secured grade one in the examination.
Measures of Central Tendency
31 Likes
Answer
- The cumulative frequency table for the given continuous distribution is :
| Marks | No. of students | Cumulative frequency |
|---|---|---|
| 0 - 10 | 5 | 5 |
| 10 - 20 | 11 | 16 |
| 20 - 30 | 10 | 26 |
| 30 - 40 | 20 | 46 |
| 40 - 50 | 28 | 74 |
| 50 - 60 | 37 | 111 |
| 60 - 70 | 40 | 151 |
| 70 - 80 | 29 | 180 |
| 80 - 90 | 14 | 194 |
| 90 - 100 | 6 | 200 |
Take 1 cm along x-axis = 10 scores
Take 1 cm along y-axis = 20 (students)
Plot the points (10, 5), (20, 16), (30, 26), (40, 46), (50, 74), (60, 111), (70, 151), (80, 180), (90, 194) and (100, 200) representing upper class limits and the respective cumulative frequencies.
Also plot the point representing lower limit of the first class i.e. 0 - 10.Join these points by a freehand drawing.
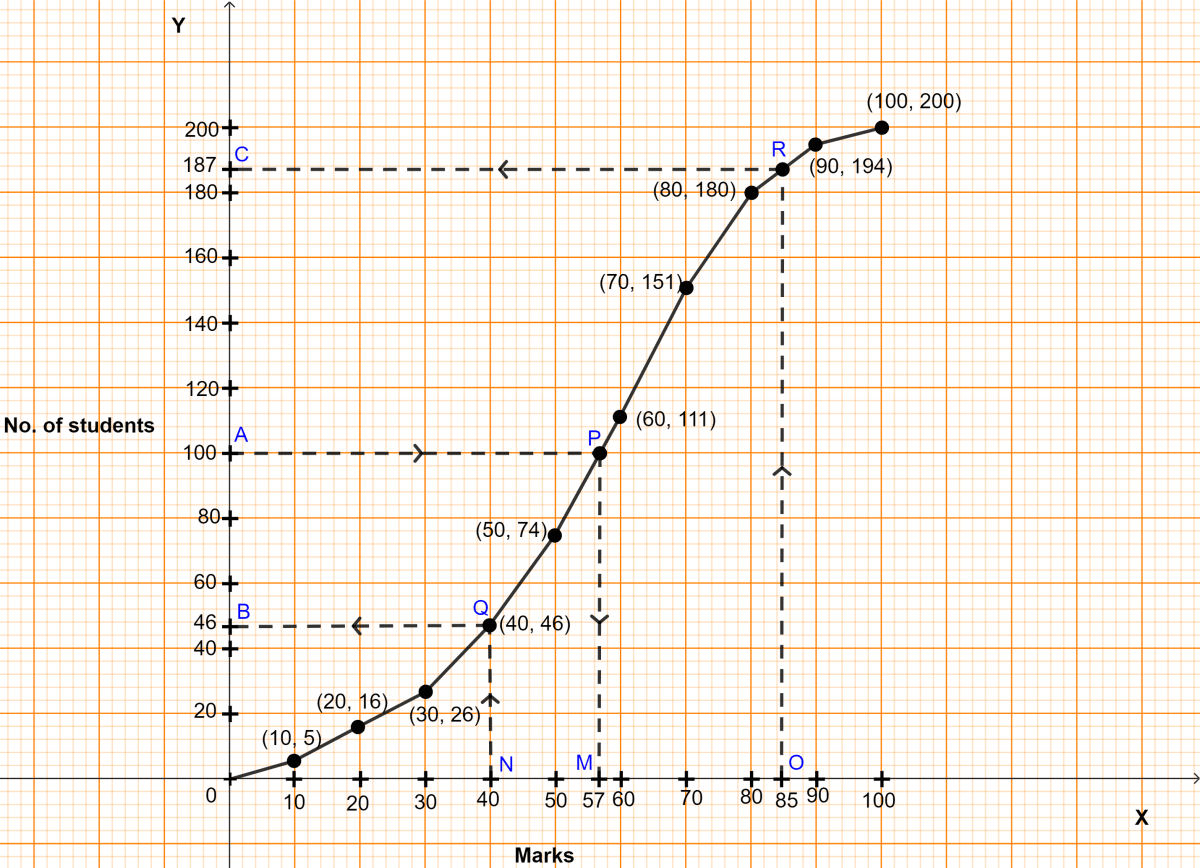
The required ogive is shown in figure above.
(i) Here, n (no. of students) = 200.
To find the median :
Let A be the point on y-axis representing frequency = = 100.
Through A draw a horizontal line to meet the ogive at P. Through P, draw a vertical line to meet the x-axis at M. The abscissa of the point M represents 57.
Hence, the required median marks = 57.
(ii) Let N be the point on x-axis representing marks = 40.
Through N, draw a vertical line to meet the ogive at Q. Through Q, draw a horizontal line to meet the y-axis at B. The ordinate of the point B represents 46.
Students who scored less than 40 = 46.
Hence, 46 students failed in the examination.
(iii) Let O be the point on x-axis representing marks = 85.
Through O, draw a vertical line to meet the ogive at R. Through R, draw a horizontal line to meet the y-axis at C. The ordinate of the point C represents 187.
Students who scored less than 85 = 187.
So, students scoring more than 85 = Total students - students scoring less than 85 = 200 - 187 = 13.
Hence, 13 students secured grade one in examination.
Answered By
16 Likes
Related Questions
The table shows the distribution of scores obtained by 160 shooters in a shooting competition. Use a graph sheet and draw an ogive for the distribution.
(Take 2 cm = 10 scores on the x-axis and 2 cm = 20 shooters on the y-axis)
Scores No. of shooters 0 - 10 9 10 - 20 13 20 - 30 20 30 - 40 26 40 - 50 30 50 - 60 22 60 - 70 15 70 - 80 10 80 - 90 8 90 - 100 7 Use your graph to estimate the following :
(i) The median.
(ii) The inter quartile range.
(iii) The number of shooters who obtained a score of more than 85%.
The daily wages of 80 workers in a project are given below :
Wages (in ₹) No. of workers 400 - 450 2 450 - 500 6 500 - 550 12 550 - 600 18 600 - 650 24 650 - 700 13 700 - 750 5 Use a graph paper to draw an ogive for the above distribution. (Use a scale of 2 cm = ₹ 50 on x-axis and 2 cm = 10 workers on y-axis). Use your ogive to estimate :
(i) the median wage of the workers.
(ii) the lower quartile wage of the workers.
(iii) the number of workers who earn more than ₹625 daily.
Use graph paper for this question.
A survey regarding height (in cm) of 60 boys belonging to class 10 of a school was conducted. The following data was recorded :
Height (in cm) No. of boys 135 - 140 4 140 - 145 8 145 - 150 20 150 - 155 14 155 - 160 7 160 - 165 6 165 - 170 1 Taking 2 cm = height of 10 cm on one axis and 2 cm = 10 boys along the other axis, draw an ogive of the above distribution. Use the graph to estimate the following :
(i) median
(ii) lower quartile
(iii) if above 158 is considered as the tall boy of the class, find the number of boys in the class who are tall.
40 students enter for a game of a shot put competition. The distance thrown in metre is recorded below:
Distance in m Number of students 12 - 13 3 13 - 14 9 14 - 15 12 15 - 16 9 16 - 17 4 17 - 18 2 18 - 19 1 Use a graph paper to draw an ogive for the above distribution.
Uses scale of 2 cm = 1 m on one axis and 2 cm = 5 students on other axis.
Hence, using your graph, find:
(i) the median
(ii) upper quartile
(iii) number of students who cover a distance which is above m.