
Mathematics
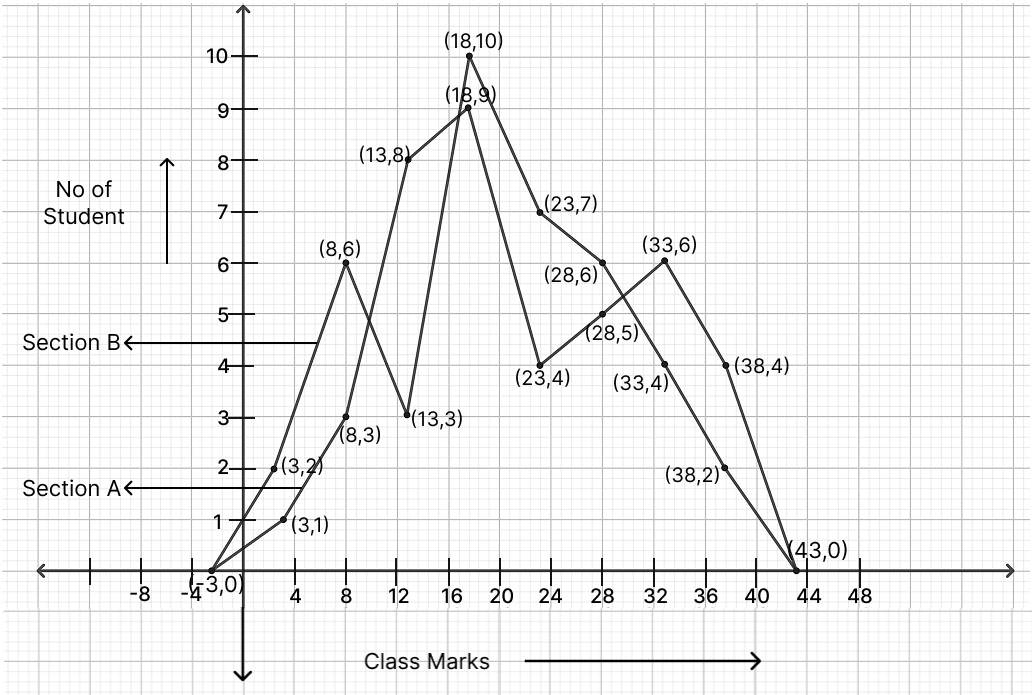
Marks scored by students of class 10A and 10B in a particular class test are as follows:
| Marks | No. of students of 10A | No. of students of 10B |
|---|---|---|
| 1 - 5 | 1 | 2 |
| 6 - 10 | 3 | 6 |
| 11 - 15 | 8 | 3 |
| 16 - 20 | 9 | 10 |
| 21 - 25 | 4 | 7 |
| 26 - 30 | 5 | 6 |
| 31 - 35 | 6 | 4 |
| 36 - 40 | 4 | 2 |
Draw their frequency polygons on the same graph.
Statistics
28 Likes
Answer
The following frequency distribution is discontinuous, to convert it into continuous frequency distribution,
Adjustment factor =
=
Subtract the adjustment factor (0.5) from all the lower limits and add the adjustment factor (0.5) to all the upper limits.
Continuous frequency distribution for given data is :
| Classes before adjustment | Classes after adjustment | Class marks | No. of students of 10A | No. of students of 10B |
|---|---|---|---|---|
| 1 - 5 | 0.5 - 5.5 | 3 | 1 | 2 |
| 6 - 10 | 5.5 - 10.5 | 8 | 3 | 6 |
| 11 - 15 | 10.5 - 15.5 | 13 | 8 | 3 |
| 16 - 20 | 15.5 - 20.5 | 18 | 9 | 10 |
| 21 - 25 | 20.5 - 25.5 | 23 | 4 | 7 |
| 26 - 30 | 25.5 - 30.5 | 28 | 5 | 6 |
| 31 - 35 | 30.5 - 35.5 | 33 | 6 | 4 |
| 36 - 40 | 35.5 - 40.5 | 38 | 4 | 2 |
Steps to draw frequency polygon :
Take 1 cm along x-axis = 4 units.
Take 1 cm along y-axis = 1 units.
Find the mid-points of class-intervals.
Find points corresponding to given frequencies of classes and the mid-points of class-intervals, and plot them.
Join consecutive points by line segments.
Join first end point with mid-point of class -5.5 - 0.5 with zero frequency and join the other end with mid-point of class 40.5 - 45.5 with zero frequency.
The required frequency polygon is shown alongside.
Answered By
24 Likes
Related Questions
The number of matchsticks in 40 boxes on counting was found as given below:
44, 41, 42, 43, 47, 50, 51, 49, 43, 42, 40, 42, 44, 45, 49, 42, 46, 49, 45, 49, 45, 47, 48, 43, 43, 44, 48, 43, 46, 50, 43, 52, 46, 49, 52, 51, 47, 43, 43, 45.
Taking classes 40 - 42, 42 - 44 ……, construct the frequency distribution table for the above data. Also draw a combined histogram and frequency polygon to represent the distribution.
The histogram showing the weekly wages (in rupees) of workers in a factory is given alongside.

Answer the following about the frequency distribution:
(i) What is the frequency of the class 400 - 425?
(ii) What is the class having minimum frequency?
(iii) What is the cumulative frequency of the class 425 – 450?
(iv) Construct a frequency and cumulative frequency table for the given distribution.
The marks obtained by 17 students in a mathematics test (out of 100) are given below :
91, 82, 100, 100, 96, 65, 82, 76, 79, 90, 46, 64, 72, 66, 68, 48, 49
The range of data is
46
54
90
100
The class mark of the class 90 - 120 is
90
105
115
120