
Physics
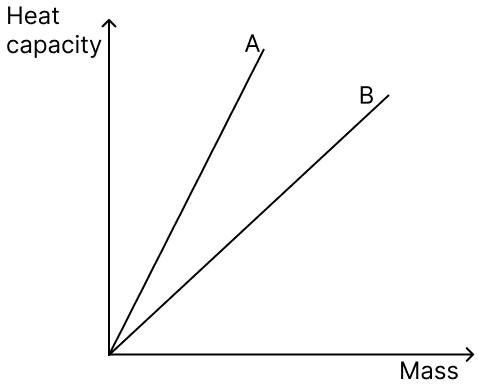
In the physics laboratory, various blocks of materials labelled A and B, each with masses ranging from 10 grams to 50 grams, are utilised to determine their respective heat capacities. Subsequently, a graph is plotted to depict the relationship between the heat capacity and the mass of the materials, as shown.
(a) Plot a graph illustrating the relationship between the mass and specific heat capacity of materials A and B.
(b) Which material is a relatively better conductor?
Calorimetry
16 Likes
Answer
(a)
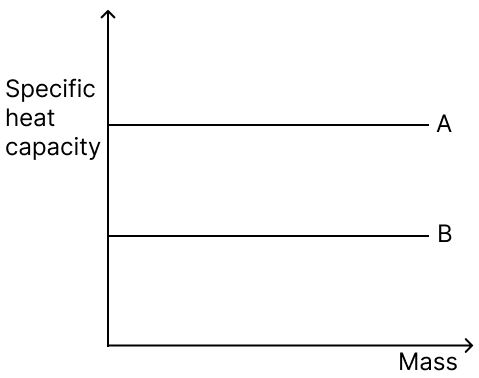
(b) B
Explanation:
Generally, materials with lower specific heat capacity heat up more quickly when thermal energy is applied. Hence, Material B, with the lower specific heat capacity, would be a better thermal conductor.
Answered By
9 Likes
Related Questions
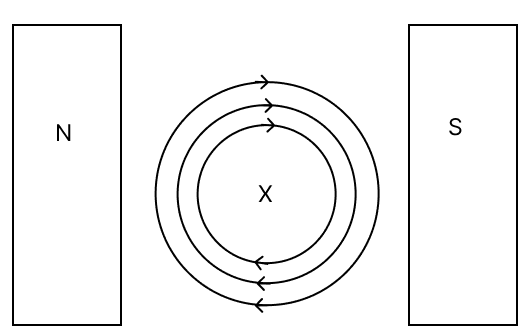
In the given diagram, X represents a conductor carrying current into the plane of the paper and kept in a magnetic field. N & S represent the poles of a magnet and concentric circles of the magnetic field produced by the conductor.
(a) State the direction of the force experienced by the conductor.
(b) Explain the cause of the above-said force.
(c) Name the law used to determine the direction of the force in the conductor.
Study the diagram and answer the following:
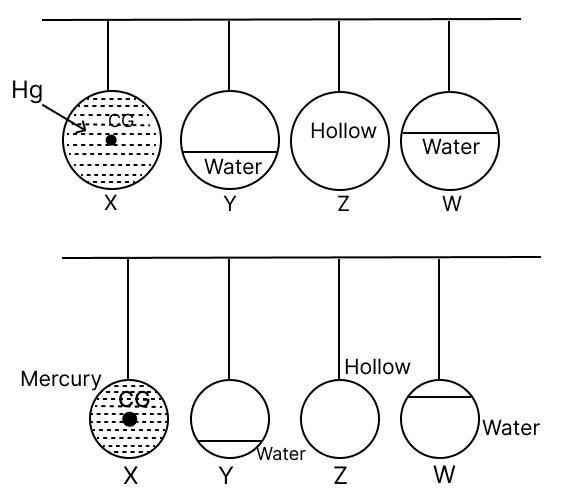
(a) Arrange the following pendulums according to their natural frequencies (use < > =).
(b) If Pendulum Z is initiated into oscillation, which pendulum among the others will exhibit the highest amplitude of vibration?
(c) Give reasons for your answer.
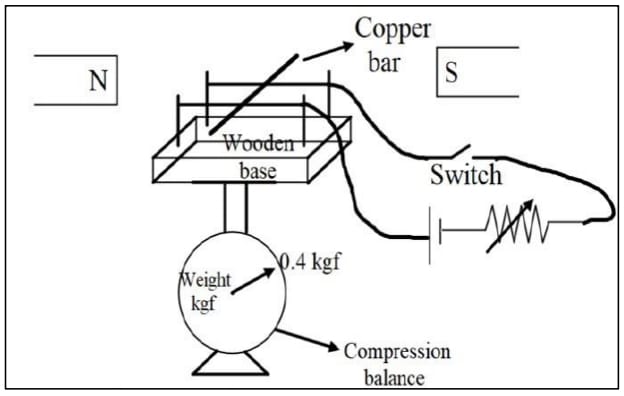
The above circuit diagram illustrates a copper bar placed on two copper wires stretched over a wooden base placed between two poles of magnets. This entire setup is placed on a compression balance, which shows a weight of 0.4 kgf.
(a) What will be the observation of the compression balance when we close the switch?
(b) How will this observation change, when we increase the current in the circuit?
(c) Name the rule used to come to the conclusion in (a).
Bandish and Parag, on a trek to Sandakpu, halted at a tea house in Tumbling. The picture above shows the entrance door of the tea house. They saw the tumbrel filled with water hanging from top rigid support passing through the door. On enquiring about the tumbrel, the owner of the tea house, he said that it acts as a pullback (door closure) after opening and releasing the door.
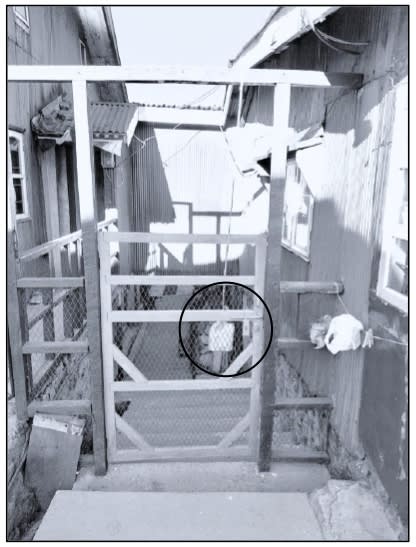
(a) Explain how the tumbrel helps to close the door on its own.
(b) Name the principle involved.