
Physics
Some quantity of water at 0°C is heated to 20°С. Identify the correct graph showing the variation of volume of water with temperature.
- 1.
-exc-6a-icse-9-phy-concise-485x377.png)
- 2.
-exc-6a-icse-9-phy-concise-447x379.png)
- 3.
-exc-6a-icse-9-phy-concise-431x356.png)
- 4.
-exc-6a-icse-9-phy-concise-506x405.png)
Heat Energy
8 Likes
Answer
option 4
Reason — As from 0°C to 4°C, water contracts so it's volume decreases as temperature increases, at 4°C water has maximum density and minimum volume and from 4°C to 20°C, water expands, i.e., volume increases as temperature increases.
So, the correct graph should show a decrease in volume from 0°C to 4°C and then an increase in volume from 4°C to 20°C. This forms a "U" shaped curve with the minimum point at 4°C.
Answered By
3 Likes
Related Questions
The property of ice which prevents the flow of heat from water of a pond (or lake) to the atmosphere is :
- conduction
- insulation
- low specific heat
- none of the above
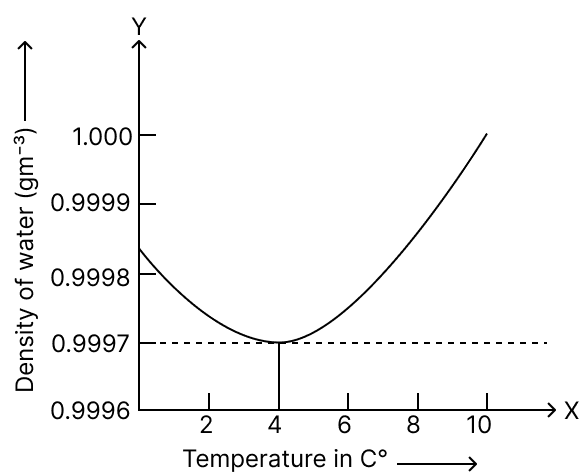
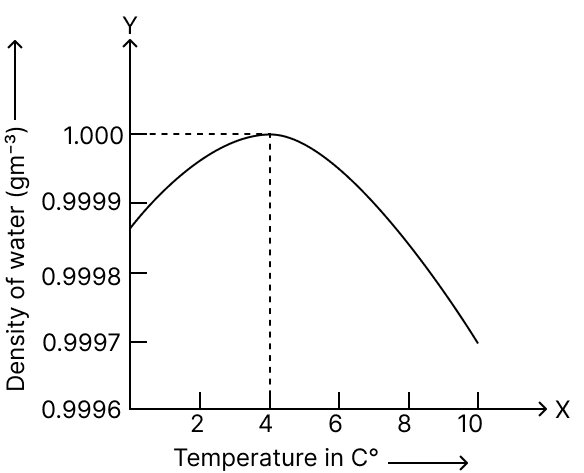
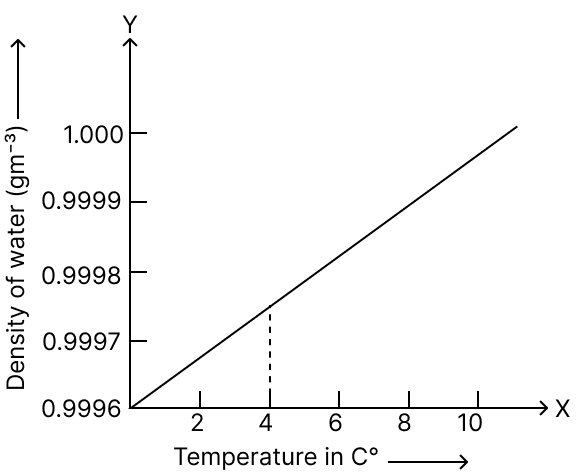
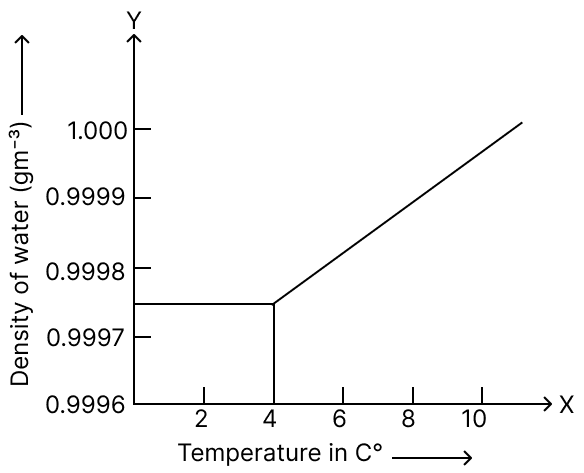
Identify the correct graph showing the variation in the density of water with temperature :
- 1.
- 2.
- 3.
- 4.
What is heat? Write it's S.I. unit.
Two bodies at different temperatures are placed in contact. State the direction in which heat will flow.