
Mathematics
For the questions with numbers 92 and 93, given above, draw a :
(i) Histogram
(ii) Frequency polygon
(iii) Frequency polygon using histogram.
Statistics
3 Likes
Answer
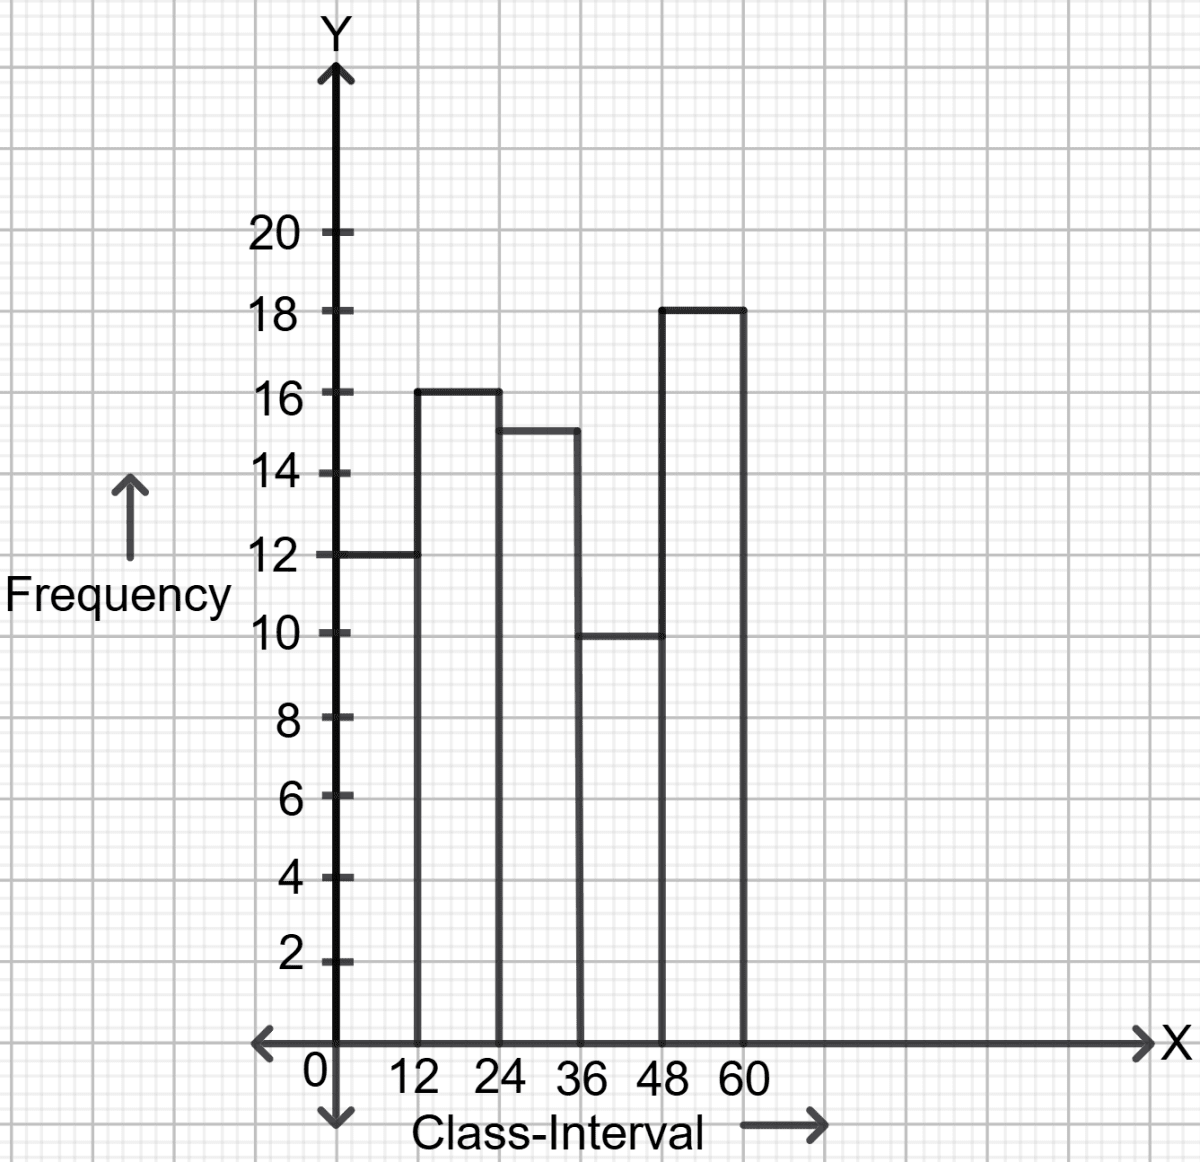
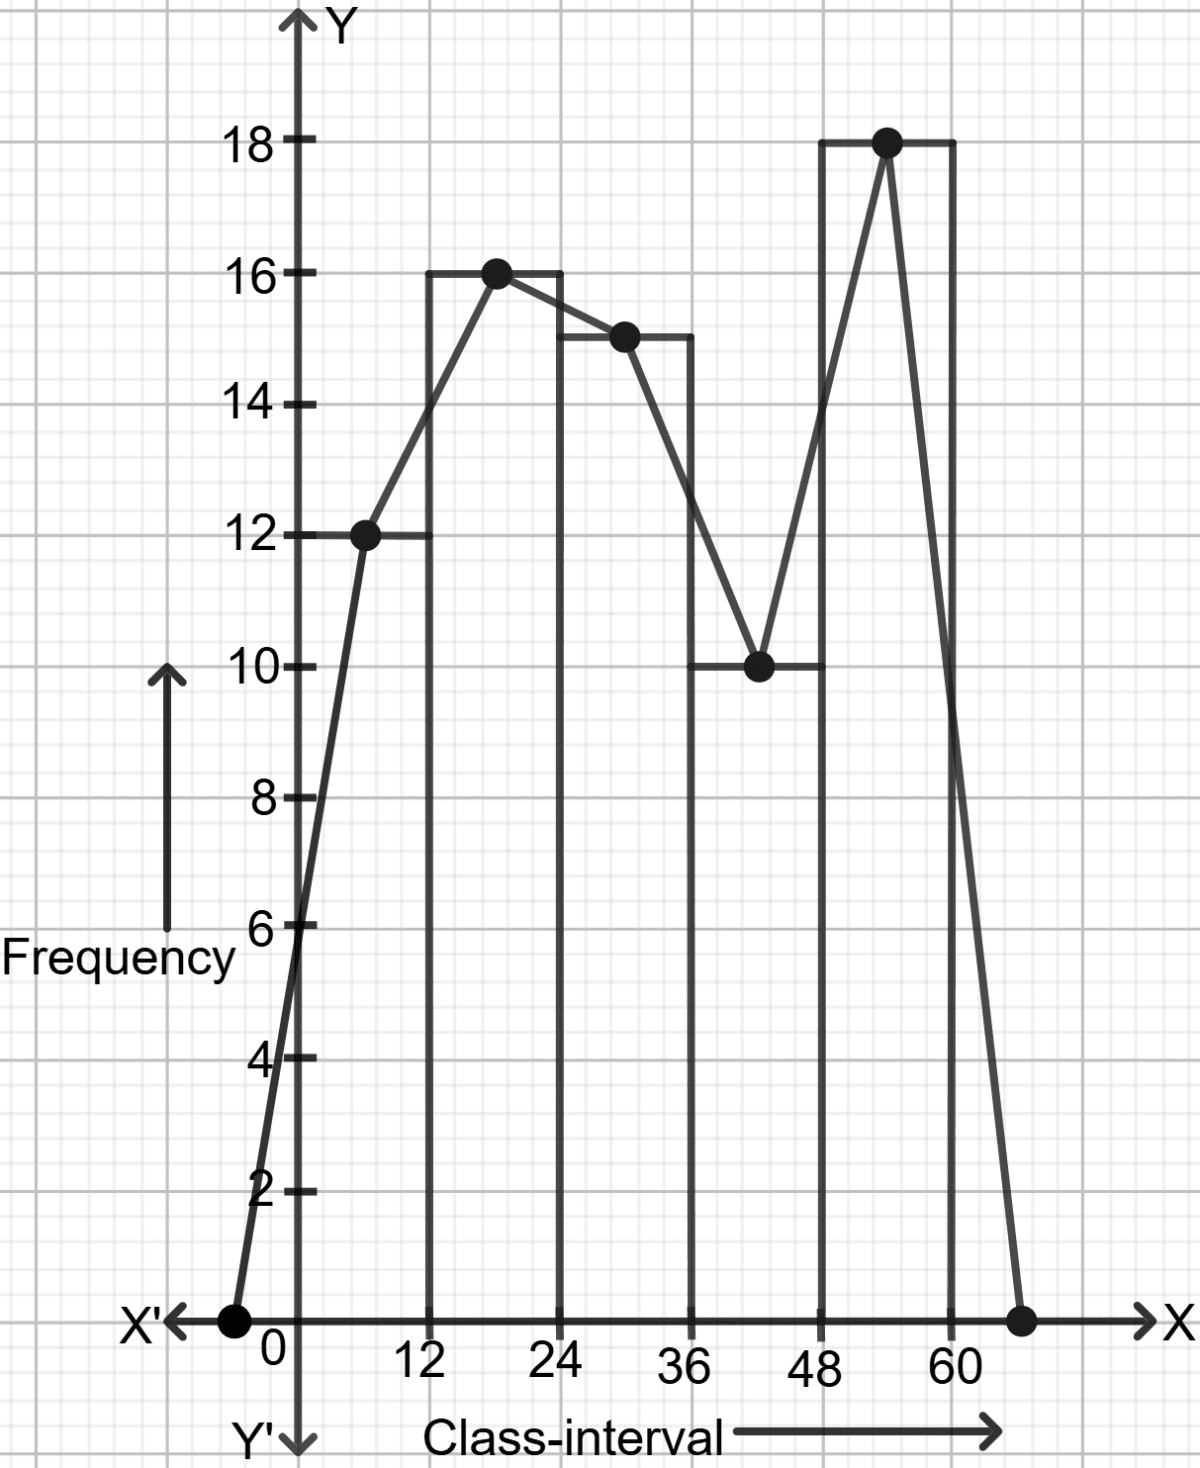
(i) The frequency table of question 92:
| C.I. | Frequency |
|---|---|
| 0-12 | 12 |
| 12-24 | 16 |
| 24-36 | 15 |
| 36-48 | 10 |
| 48-60 | 18 |
Steps to draw Histogram:
On x-axis, mark the class intervals.
On y-axis, mark frequencies.
Construct rectangles with class-intervals as bases and the corresponding frequencies as heights.
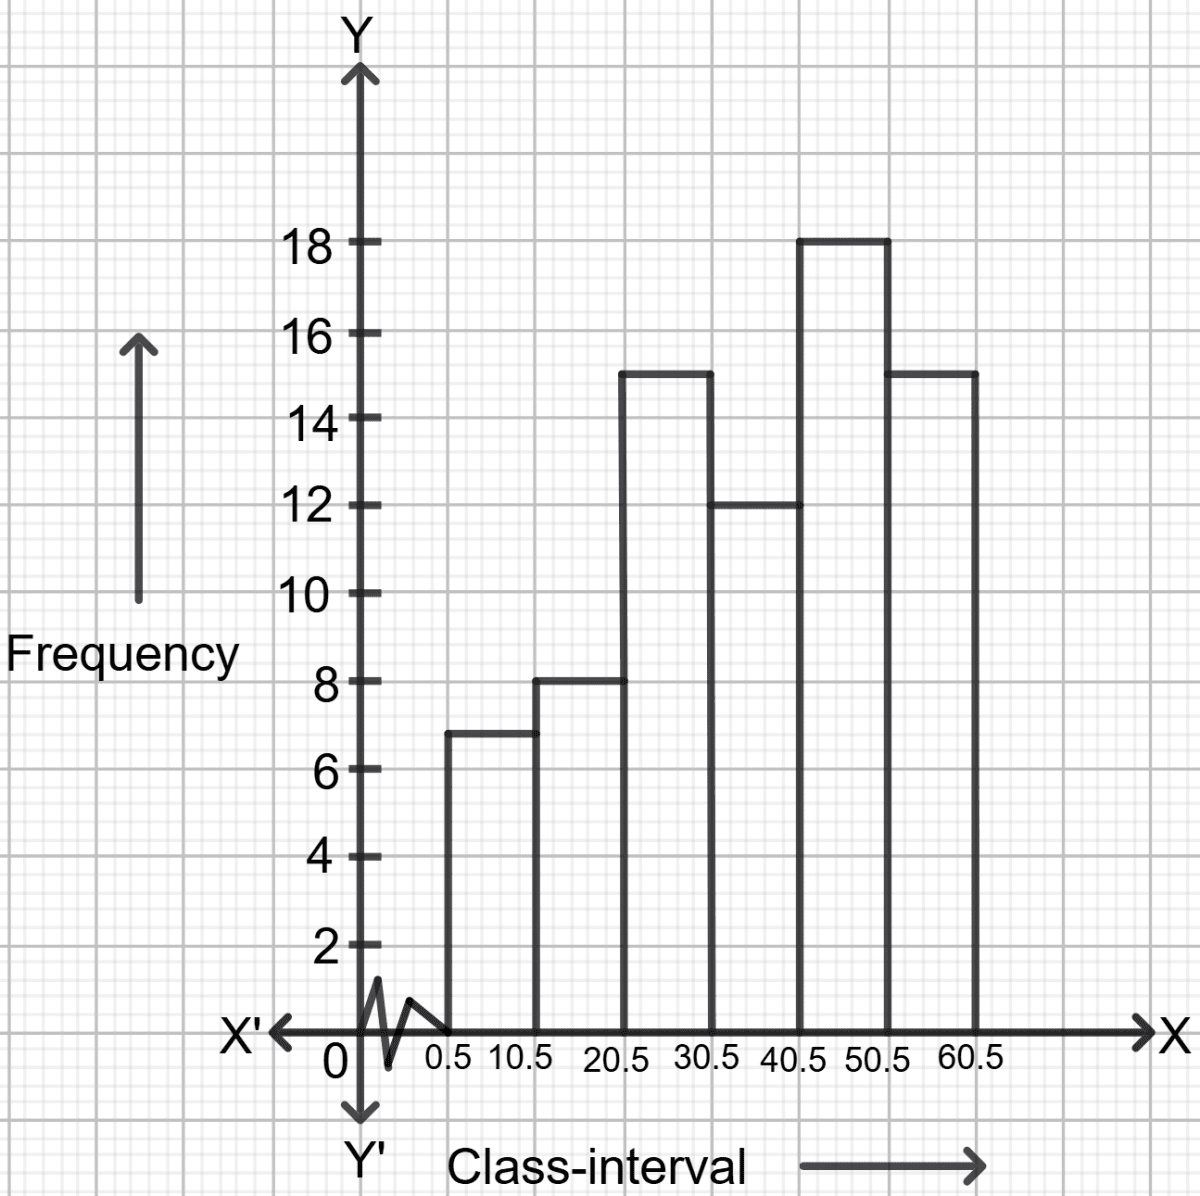
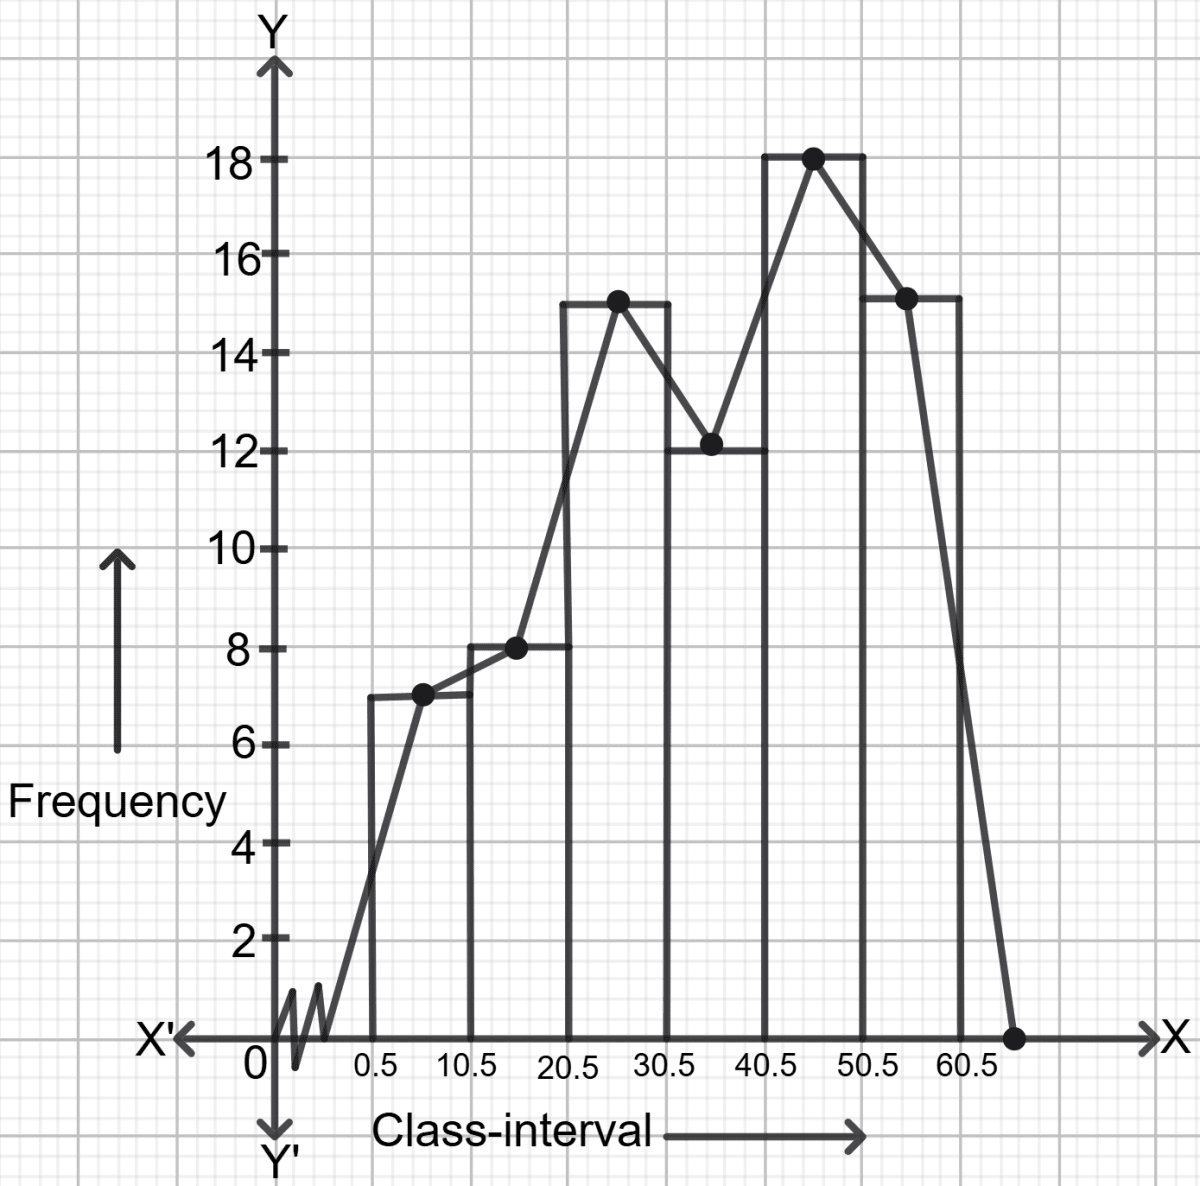
The frequency table of question 93:
| Class interval | Cumulative frequency | frequency |
|---|---|---|
| 1-10 | 7 | 7 |
| 11-20 | 15 | 15 - 7 = 8 |
| 21-30 | 30 | 30 - 15 = 15 |
| 31-40 | 42 | 42 - 30 = 12 |
| 41-50 | 60 | 60 - 42 = 18 |
| 51-60 | 75 | 75 - 60 = 15 |
The class intervals are inclusive, so first convert the classes into the exclusive form.
On converting the class intervals to exclusive form, we get the following actual class limits:
| Class interval | frequency |
|---|---|
| 0.5-10.5 | 7 |
| 10.5-20.5 | 8 |
| 20.5-30.5 | 15 |
| 30.5-40.5 | 12 |
| 40.5-50.5 | 18 |
| 50.5-60.5 | 15 |
Steps to draw Histogram:
On x-axis, mark the class intervals.
On the y-axis, mark frequencies.
Construct rectangles with class-intervals as bases and the corresponding frequencies as heights.
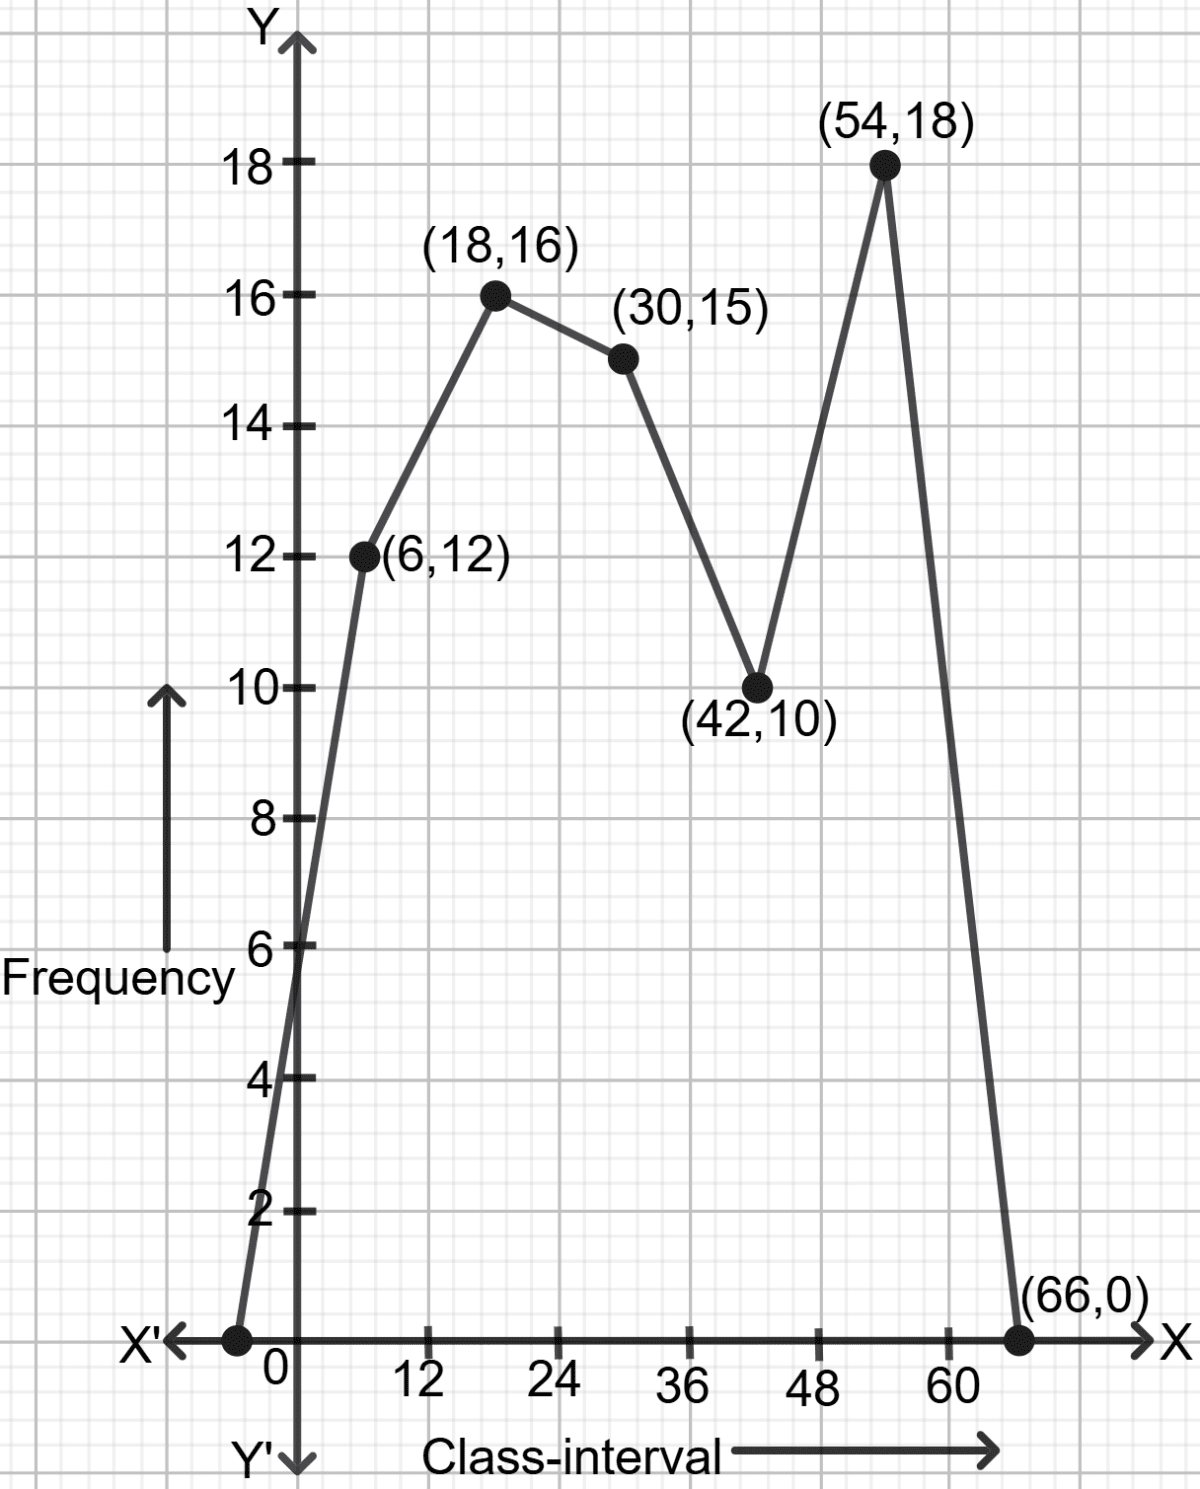
(ii) The frequency table of question 92:
| C.I. | Class-mark | Frequency |
|---|---|---|
| 0-12 | 12 | |
| 12-24 | 16 | |
| 24-36 | 15 | |
| 36-48 | 10 | |
| 48-60 | 18 |
Steps to draw frequency polygon:
- Find the class-mark (mid-value) of each given class-intervals.
Class-mark = mid-value =
On a graph paper, mark class-mark along x-axis and frequencies along y-axis.
On a graph paper, mark points taking values of class-marks along x-axis and the values of their corresponding frequencies along y-axis.
Draw line segments joining the consecutive points marked in step (3) above.
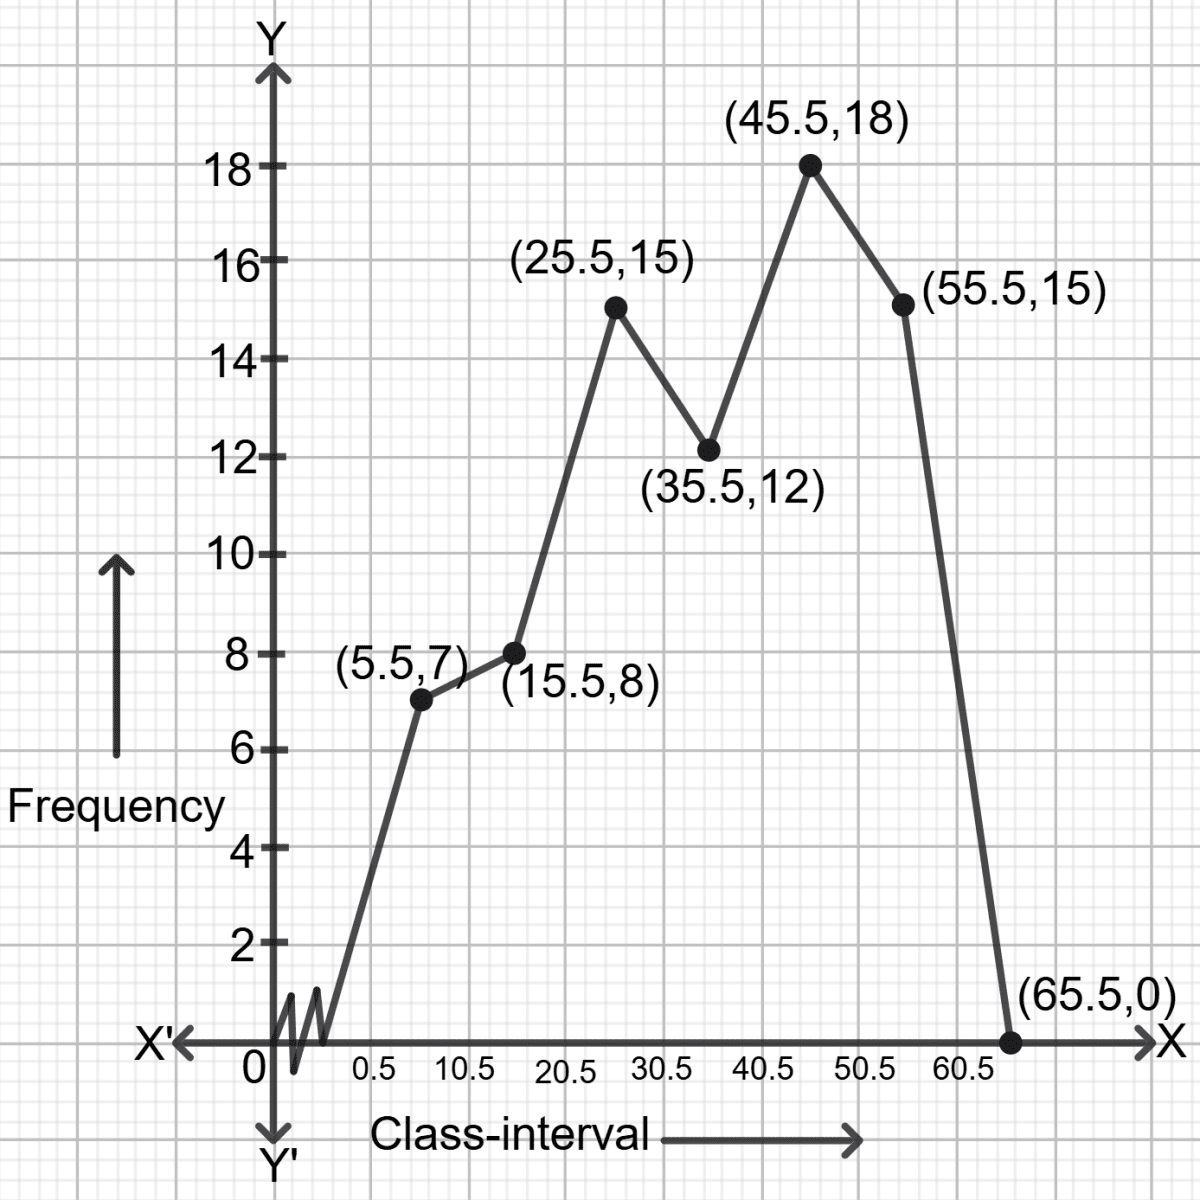
The frequency table of question 93:
| Class interval | Class mark | frequency |
|---|---|---|
| 0-0.5 | 0 | |
| 0.5-10.5 | 7 | |
| 10.5-20.5 | 8 | |
| 20.5-30.5 | 15 | |
| 30.5-40.5 | 12 | |
| 40.5-50.5 | 18 | |
| 50.5-60.5 | 15 |
Steps to draw frequency polygon:
- Find the class-mark (mid-value) of each given class-intervals.
Class-mark = mid-value =
On a graph paper, mark class-mark along x-axis and frequencies along y-axis.
On a graph paper, mark points taking values of class-marks along x-axis and the values of their corresponding frequencies along y-axis.
Draw line segments joining the consecutive points marked in step (3) above.
(iii) The frequency table of question 92:
| C.I. | Class-mark | Frequency |
|---|---|---|
| 0-12 | 12 | |
| 12-24 | 16 | |
| 24-36 | 15 | |
| 36-48 | 10 | |
| 48-60 | 18 |
Steps to draw frequency polygon using histogram:
On x-axis, mark the class intervals.
On y-axis, mark frequencies.
Construct rectangles with class-intervals as bases and the corresponding frequencies as heights.
Mark the mid-points at the top of each rectangle of the histogram drawn.
Also, mark the mid-point of the immediately lower class-interval ( in the given example, the immediately lower class-interval is -12-0) and mid-point of the immediately higher class-interval (in the given example the immediate upper class-interval is 60-72).
Join the consecutive mid-points marked by straight lines to obtain the required frequency polygon.
The frequency table of question 93:
| Class interval | Class mark | frequency |
|---|---|---|
| 0.5-10.5 | 7 | |
| 10.5-20.5 | 8 | |
| 20.5-30.5 | 15 | |
| 30.5-40.5 | 12 | |
| 40.5-50.5 | 18 | |
| 50.5-60.5 | 15 |
Steps to draw frequency polygon using histogram:
On x-axis, mark the class intervals.
On y-axis, mark frequencies.
Construct rectangles with class-intervals as bases and the corresponding frequencies as heights.
Mark the mid-points at the top of each rectangle of the histogram drawn.
Also, mark the mid-point of the immediately lower class-interval ( in the given example, the immediately lower class-interval is 0-0.5) and mid-point of the immediately higher class-interval (in the given example the immediate upper class-interval is 60.5-70.5).
Join the consecutive mid-points marked by straight lines to obtain the required frequency polygon.
Answered By
1 Like
Related Questions
Construct a cumulative frequency distribution table from the following frequency table :
C.I. Frequency 0-12 12 12-24 16 24-36 15 36-48 10 48-60 18 Construct a frequency table from the following cumulative frequency table :
Class interval Cumulative frequency 1-10 7 11-20 15 21-30 30 31-40 42 41-50 60 51-60 75 Find the mean of the following numbers :
62, 58, 84, 71, 68, 70, 53, 63, 56 and 65.
Find median for the following data :
50 59 27 78 54 72 58 57 31 65 42 60 22 37 40 and 28