
Physics
A student performs an experiment to study the dependence of the time period (T) of a simple pendulum on its length. The length of the pendulum is changed each time. For every length, the time taken for 20 oscillations is recorded.
Note: The experiment is carried out in a school laboratory using the same bob.
The recorded observations are as follows:
| Length (m) | Time taken for 20 oscillation (s) |
|---|---|
| 0.40 | 25.4 |
| 0.60 | 31.0 |
| 0.90 | 38.0 |
| 1.00 | 40.2 |
(a) Calculate the time period for each length of the pendulum.
(b) Draw a graph between T2 and the length of the pendulum.
(c) What conclusion can be drawn from the graph?
(d) Which physical parameter can be calculated using the slope of the above graph?
(e) If the same experiment is conducted on the Moon, would the graph remain the same? Give reason
Measurements
8 Likes
Answer
(a) The time period T is the time taken for one oscillation and since the time given is for 20 oscillations, then time T is given by,
(b) The table below shows length (l) and T2:
| Length | T2 |
|---|---|
| 0.40 | (1.27)2 = 1.61 |
| 0.60 | (1.55)2 = 2.40 |
| 0.90 | (1.90)2 = 3.61 |
| 1.00 | (2.01)2 = 4.04 |
The graph between T2 and the length (l) of the pendulum is shown below :
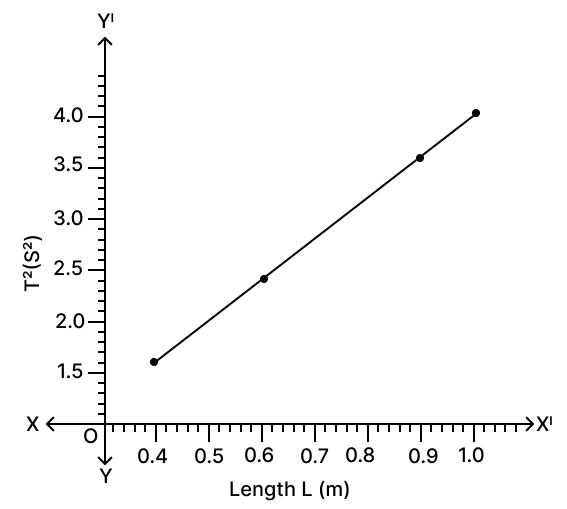
(c) As the graph is a straight line, we can conclude that T2 is directly proportional to the length (l) of the pendulum.
(d) From the relation
The slope of the T2 vs l graph can be used to calculate the acceleration due to gravity (g).
(e) No, the graph would not remain the same on the Moon because the value of acceleration due to gravity (g) on the Moon is smaller than on Earth. Since , the time period would increase, changing the slope of the graph.
Answered By
3 Likes
Related Questions
Assertion (A) : Smaller the least count of an instrument, more precise the measurement made by using it.
Reason (R) : Least count of an instrument is the smallest measurement that can be taken accurately with it.
- both A and R are true and R is the correct explanation of A
- both A and R are true and R is not the correct explanation of A
- assertion is false but reason is true
- assertion is true but reason is false
Assertion (A) : The least count of a screw gauge can be decreased by increasing the pitch and decreasing the total number of divisions on circular scale.
Reason (R) : Least count of screw gauge is directly proportional to pitch of the screw gauge.
- both A and R are true and R is the correct explanation of A
- both A and R are true and R is not the correct explanation of A
- assertion is false but reason is true
- assertion is true but reason is false
Assertion (A) : A pendulum clock goes slow (i.e., the time period of oscillation increases) when it is taken to mines.
Reason (R) : This is due to increase in the value of acceleration due to gravity g.
- both A and R are true and R is the correct explanation of A
- both A and R are true and R is not the correct explanation of A
- assertion is false but reason is true
- assertion is true but reason is false
During a Physics practical, Ayush and Reema measured the length of a metal rod using two measuring instruments A and B. Ayush used instrument A and obtained a reading of 25.4 cm, while Reema used instrument B and obtained a reading of 25.36 cm.
(a) Why did Ayush and Reema get different values for the same length?
(b) Which measuring instrument is more accurate, A or B?
(c) Can you identify the measuring instruments A and B?
(d) Why is it important to use S.I. units while recording measurements?