
Mathematics
A survey regarding height (in cm) of 60 boys belonging to class 10 of a school was conducted. The following data was recorded:
| Height (in cm) | Number of boys |
|---|---|
| 135 - 140 | 4 |
| 140 - 145 | 8 |
| 145 - 150 | 20 |
| 150 - 155 | 14 |
| 155 - 160 | 7 |
| 160 - 165 | 6 |
| 165 - 170 | 1 |
Taking 2 cm = height of 10 cm along one axis and 2 cm = 10 boys along the other axis, draw an ogive of the above distribution. Use the graph to estimate the following :
(i) the median
(ii) the lower quartile
(iii) if above 158 cm is considered as the tall boys of the class, find the number of boys in the class who are tall.
Measures of Central Tendency
2 Likes
Answer
The cumulative frequency table for the given continuous distribution is :
| Height (in cm) | No. of boys | Cumulative frequency |
|---|---|---|
| 135 - 140 | 4 | 4 |
| 140 - 145 | 8 | 12 |
| 145 - 150 | 20 | 32 |
| 150 - 155 | 14 | 46 |
| 155 - 160 | 7 | 53 |
| 160 - 165 | 6 | 59 |
| 165 - 170 | 1 | 60 |
Take 2 cm along x-axis = 5 cm (height)
Take 2 cm along y-axis = 10 (No. of boys)
Since, scale on x-axis starts at 135, a kink is shown near the origin on x-axis to indicate that the graph is drawn to scale beginning at 135.
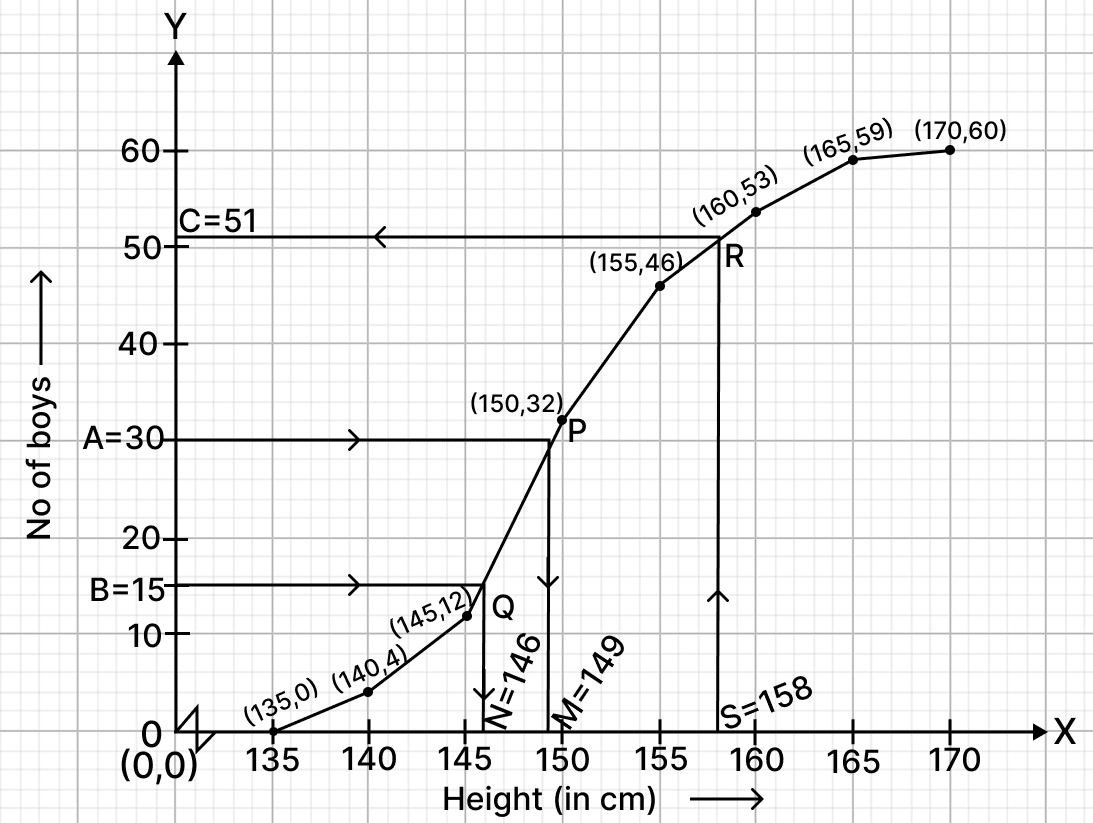
Plot the points (140, 4), (145, 12), (150, 32), (155, 46), (160, 53), (165, 59) and (170, 60) representing upper class limits and the respective cumulative frequencies.
Also plot the point (135, 0) representing lower limit of the first class i.e. 135 - 140.
- Join these points by a freehand drawing.
The required ogive is shown in figure above.
(i) Here, n (no. of students) = 60.
To find the median :
Let A be the point on y-axis representing frequency = = 30.
Through A draw a horizontal line to meet the ogive at P. Through P, draw a vertical line to meet the x-axis at M. The abscissa of the point M represents 149.
Hence, the median height = 149 cm.
(ii) To find lower quartile :
Let B be the point on y-axis representing frequency = = 15.
Through B, draw a horizontal line to meet the ogive at Q. Through Q, draw a vertical line to meet the x-axis at N. The abscissa of the point N represents 146.
Hence, lower quartile = 146 cm.
(iii) Let S be the point on x-axis representing height = 158 cm.
Through S, draw a vertical line to meet the ogive at R. Through R, draw a horizontal line to meet the y-axis at C. The ordinate of the point C represents 51.
No. of boys shorter than 158 cm = 51
So, no. of boys taller than 158 cm = Total boys - boys shorter than 158 cm = 60 - 51 = 9.
Hence, there are 9 tall boys in the class.
Answered By
1 Like
Related Questions
Using a graph paper, draw an ogive for the distribution which shows the marks obtained on the General knowledge paper by 100 students.
Marks No. of students 0 - 10 5 10 - 20 10 20 - 30 20 30 - 40 25 40 - 50 15 50 - 60 12 60 - 70 9 70 - 80 4 Use the ogive to estimate:
(i) the median
(ii) the number of students whose score is above 65.
The table shows the distribution of the scores obtained by 160 shooters in a shooting competition. Use a graph sheet and draw an ogive for the distribution (take 2 cm = 10 scores on the x-axis and 2 cm = 20 shooters on the y-axis.)
Scores Number of shooters 0 - 10 9 10 - 20 13 20 - 30 20 30 - 40 26 40 - 50 30 50 - 60 22 60 - 70 15 70 - 80 10 80 - 90 8 90 - 100 7 Use your graph to estimate the following:
(i) the median
(ii) the inter-quartile range
(iii) the number of shooters who obtained a score of more than 85%
40 students enter for a game of shot put competition. The distance thrown (in metres) is recorded below.
Distance (in m) Number of students 12 - 13 3 13 - 14 9 14 - 15 12 15 - 16 9 16 - 17 4 17 - 18 2 18 - 19 1 Use a graph paper to draw an ogive for the above distribution.
Use a scale of 2 cm = 1 m on one axis and 2 cm = 5 students on the other axis. Hence using your graph, find
(i) the median
(ii) Upper quartile
(iii) Number of students who cover a distance which is above 16 m.
Use graph paper to answer this question:
During a medical checkup of 60 students in a school, weights were recorded as follows:
Weight (in kg) Number of students 28 - 30 2 30 - 32 4 32 - 34 10 34 - 36 13 36 - 38 15 38 - 40 9 40 - 42 5 42 - 44 2 Taking 2 cm = 2 kg along one axis and 2 cm = 10 students along the other axis, draw an ogive. Use your graph to find the:
(i) Median
(ii) Upper quartile
(iii) Number of students whose weight is above 37 kg