
Mathematics
The table given below shows the runs scored by a cricket team during the overs of a match.
| Overs | Runs scored |
|---|---|
| 20-30 | 37 |
| 30-40 | 45 |
| 40-50 | 40 |
| 50-60 | 60 |
| 60-70 | 51 |
| 70-80 | 35 |
(a) Draw a histogram representing the above distribution.
(b) Estimate the modal runs scored.
Statistics
ICSE Sp 2025
23 Likes
Answer
Steps :
Take 2 cm along x-axis = 10 overs and 1 cm along y-axis = 10 runs.
Since, the scale on x-axis starts at 20, a break (zig-zag curve) is shown near the origin along x-axis to indicate that the graph is drawn to scale beginning at 20 and not at origin itself.
Construct rectangles corresponding to the given data.
In highest rectangle, draw two st. lines KN and LI from corners of the rectangles on either side of the highest rectangle to the opposite corners of the highest rectangle. Let Z be the point of intersection of KN and LI.
Through Z, draw a vertical line to meet the x-axis at A. The abscissa of the point A represents 57.
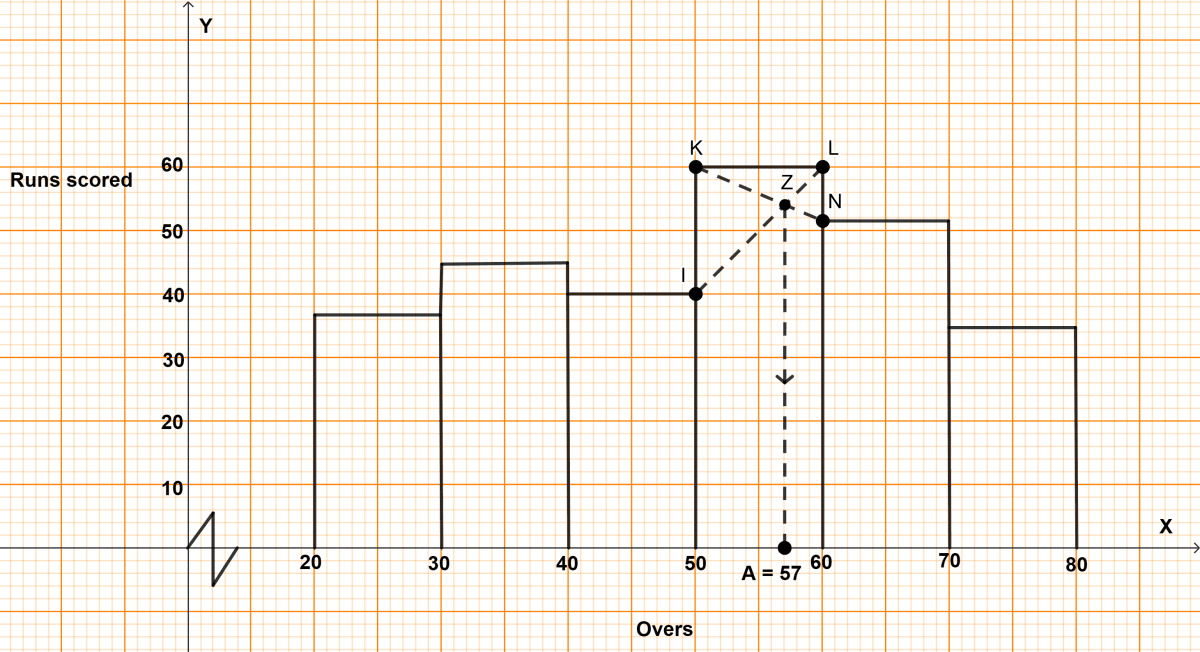
Hence, mode = 57.
Answered By
13 Likes
Related Questions
If x, y and z are in continued proportion, prove that :
A manufacturing company prepares spherical ball bearings, each of radius 7 mm and mass 4 g. These ball bearings are packed into boxes. Each box can have maximum of 2156 cm3 of ball bearings. Find the :
(a) maximum number of ball bearings that each box can have.
(b) mass of each box of ball bearings in kg.
An arithmetic progression (A.P.) has 3 as its first term. The sum of the first 8 terms is twice the sum of the first 5 terms. Find the common difference of the A.P.
The roots of the equation (q - r)x2 + (r - p)x + (p - q) = 0 are equal.
Prove that : 2q = p + r, that is, p, q and r are in A.P.