
Mathematics
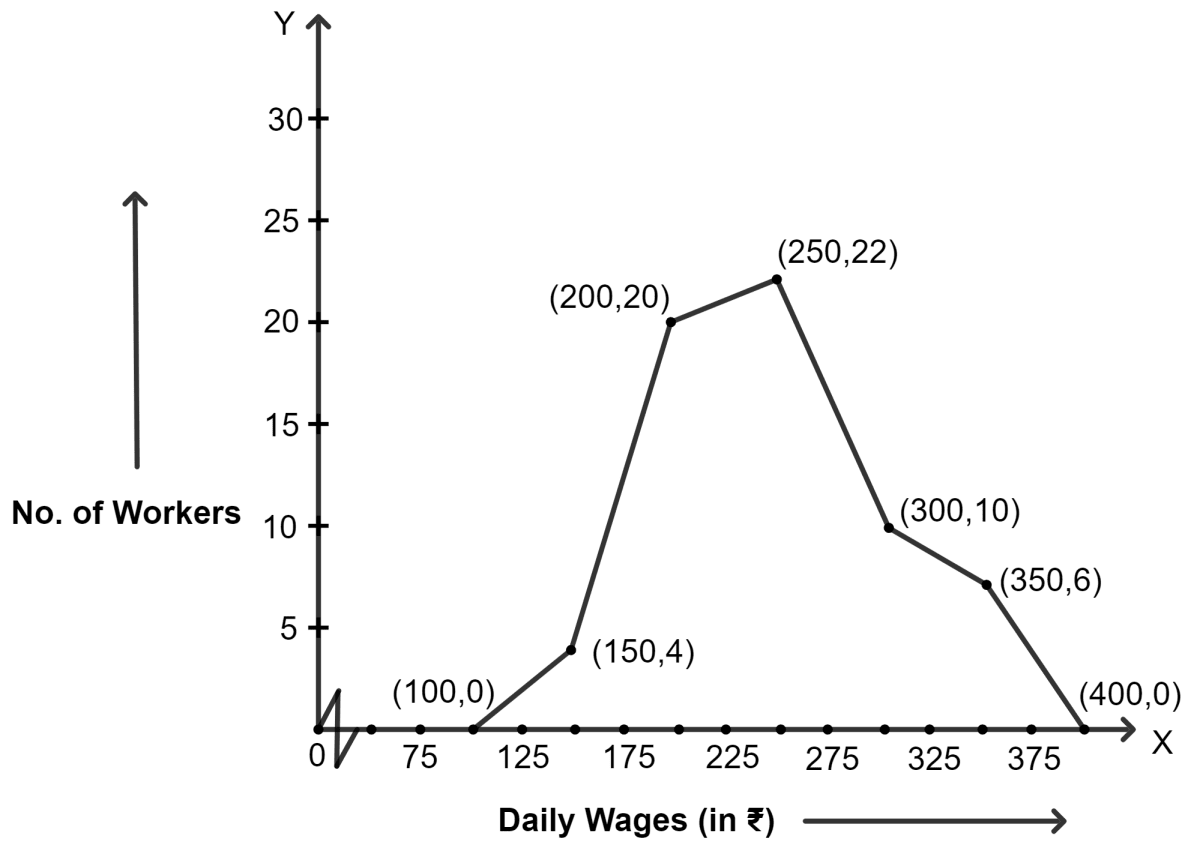
The daily wages in a factory are distributed as follows :
| Daily wages (in ₹) | 125 - 175 | 175 - 225 | 225 - 275 | 275 - 325 | 325 - 375 |
|---|---|---|---|---|---|
| Number of workers | 4 | 20 | 22 | 10 | 6 |
Draw a frequency polygon for this distribution.
Statistics
61 Likes
Answer
| Daily wages (in ₹) | No. of workers | Class marks |
|---|---|---|
| 75 - 125 | 0 | |
| 125 - 175 | 4 | |
| 175 - 225 | 20 | |
| 225 - 275 | 22 | |
| 275 - 325 | 10 | |
| 325 - 375 | 6 | |
| 375 - 425 | 0 |
Steps:
Find the class-mark (mid-value) of each given class-interval.
Class-mark mid-value =
On a graph paper, mark class-marks along x-axis and frequencies along y-axis.
On this graph paper, mark points taking values of class-marks along x-axis and the values of their corresponding frequencies along y-axis.
Draw line segments joining the consecutive points marked in step (3) above.
Answered By
40 Likes
Related Questions
Construct a combined histogram and frequency polygon for the following frequency distribution :
Class-intervals 10 - 20 20 - 30 30 - 40 40 - 50 50 - 60 Frequency 3 5 6 4 2 Construct a frequency polygon for the following data :
Class-intervals 10 - 14 15 - 19 20 - 24 25 - 29 30 - 34 Frequency 5 8 12 9 4 The class-mark of class 19 - 30 is:
In a frequency distribution, mid-values of the class is 10 and width of the class is 6, the lower limit of the class is :
6
7
8
9