Mathematics
The daily canteen bill of 30 employees in an establishment are distributed as follows :
| Daily canteen bill (in ₹) | No. of employees |
|---|---|
| 0 - 10 | 1 |
| 10 - 20 | 8 |
| 20 - 30 | 10 |
| 30 - 40 | 5 |
| 40 - 50 | 4 |
| 50 - 60 | 2 |
Estimate the modal daily canteen bill for this distribution by a graphical method.
Answer
Steps :
Take 2 cm along x-axis = 10 rupees and 1 cm along y-axis = 1 employee.
Construct rectangles corresponding to the given data.
In highest rectangle, draw two st. lines AC and BD from corners of the rectangles on either side of the highest rectangle to the opposite corners of the highest rectangle. Let P be the point of intersection of AC and BD.
Through P, draw a vertical line to meet the x-axis at M. The abscissa of the point M represents 23.

Hence, the required mode = ₹23.
Related Questions
The marks scored by 16 students in a class test are :
3, 6, 8, 13, 15, 5, 21, 23, 17, 10, 9, 1, 20, 21, 18, 12.
Find :
(i) the median
(ii) lower quartile
(iii) upper quartile
(iv) inter quartile range.
Calculate the mean, the median and the mode of the following distribution :
Age in years No. of students 12 2 13 3 14 5 15 6 16 4 17 3 18 2 Draw a cumulative frequency curve for the following data :
Marks obtained No. of students 0 - 10 8 10 - 20 10 20 - 30 22 30 - 40 40 40 - 50 20 Hence, determine :
(i) the median
(ii) the pass marks if 85% of the students pass.
(iii) the marks which 45% of the students exceed.
The given graph with a histogram represents the number of plants of different heights grown in a school campus. Study the graph carefully and answer the following questions :
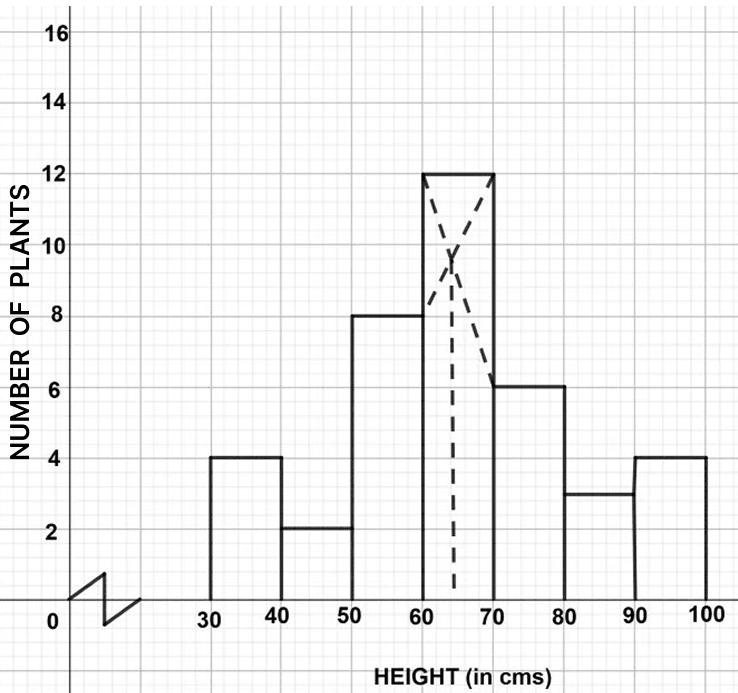
(a) Make a frequency table with respect to the class boundaries and their corresponding frequencies.
(b) State the modal class.
(c) Identify and note down the mode of the distribution.
(d) Find the number of plants whose height range is between 80 cm to 90 cm.