
Mathematics
The daily wages of workers in a construction unit were recorded as follows :
| Class marks (Wages) | No. of workers |
|---|---|
| 425 | 6 |
| 475 | 12 |
| 525 | 15 |
| 575 | 17 |
| 625 | 7 |
| 675 | 13 |
Form a frequency distribution table with class intervals and find modal wage by plotting a histogram.
Statistics
40 Likes
Answer
Difference between two consecutive class marks = 475 - 425 = 50.
Adjustment factor = = 25.
Lower class limit = Class mark - Adjustment factor
Upper class limit = Class mark + Adjustment factor
| Class | Frequency |
|---|---|
| 400-450 | 6 |
| 450-500 | 12 |
| 500-550 | 15 |
| 550-600 | 17 |
| 600-650 | 7 |
| 650-700 | 3 |
Steps of construction :
Take 2 cm along x-axis = ₹50 and 2 cm along y-axis = 5 workers.
Construct rectangles corresponding to the given data.
In highest rectangle, draw two st. lines AD and BC from corners of the rectangles on either side of the highest rectangle to the opposite corners of the highest rectangle.
Let K be the point of intersection of AD and BC. Through K, draw a vertical line to meet the x-axis at L. The abscissa of the point L represents 557.50.
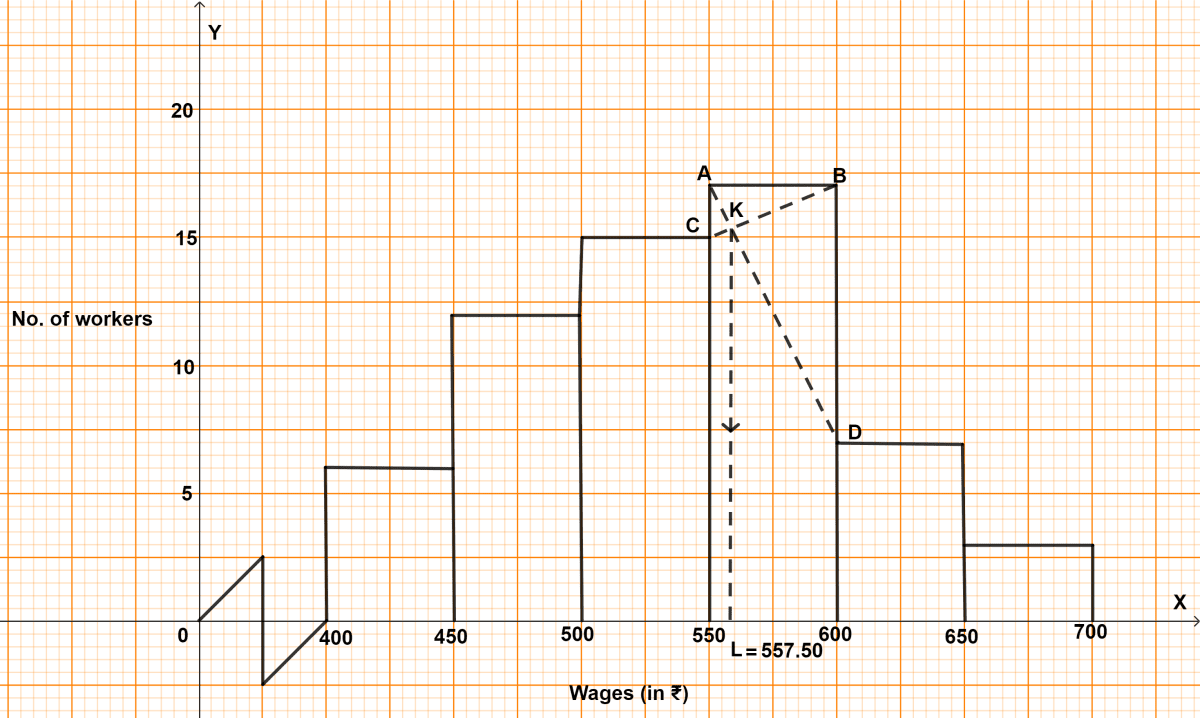
Hence, mode = ₹ 557.50
Answered By
24 Likes
Related Questions
In the given figure (not drawn to scale), BC is parallel to EF, CD is parallel to FG, AE : EB = 2 : 3, ∠BAD = 70°, ∠ACB = 105°, ∠ADC = 40° and AC is bisector of ∠BAD.
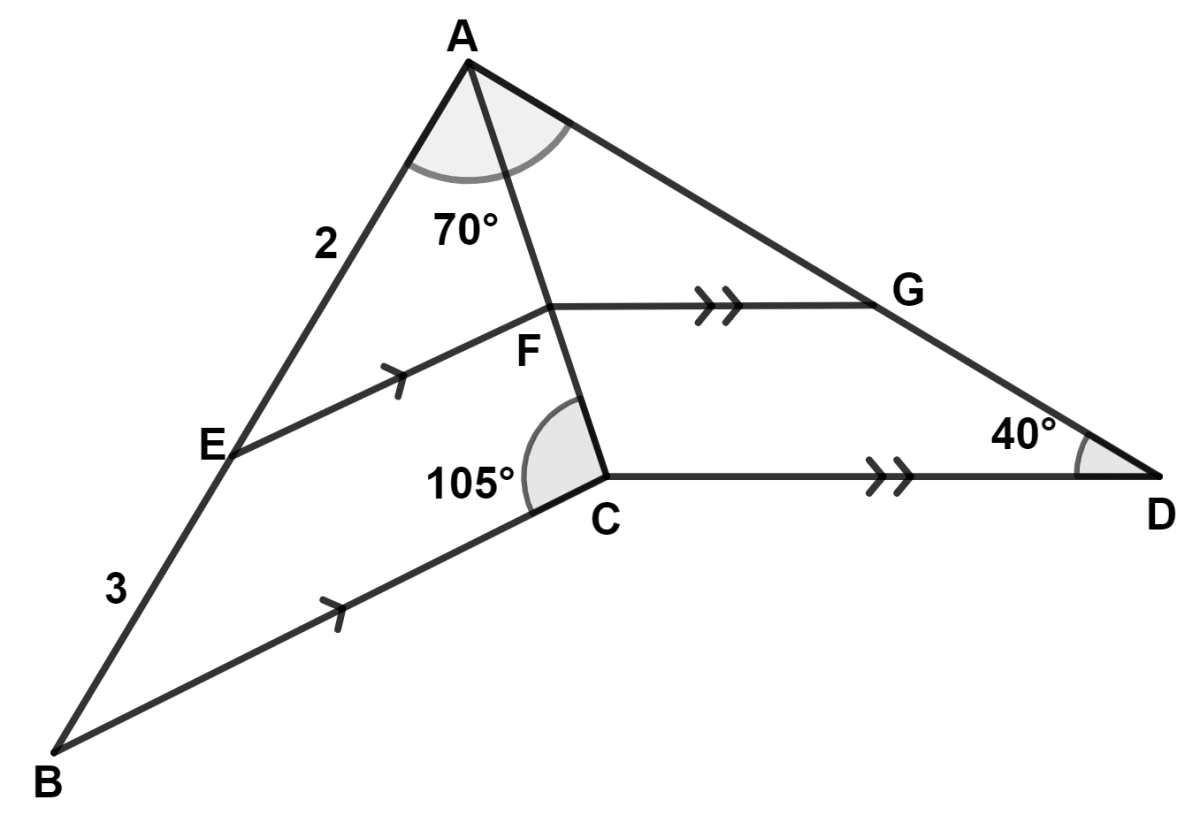
(a) Prove Δ AEF ~ Δ AGF
(b) Find :
(i) AG : AD
(ii) area of Δ ACB: area Δ ACD
(iii) area of quadrilateral ABCD: area of Δ ACB.
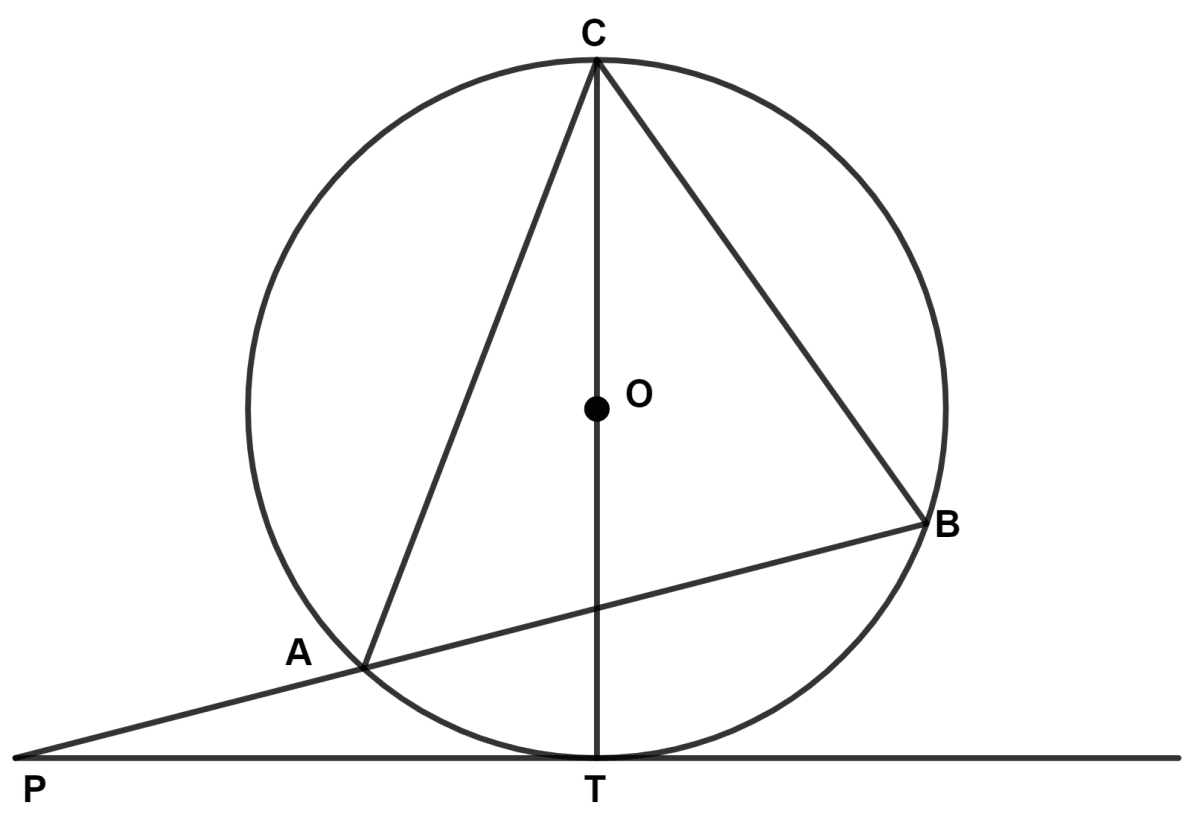
In the given figure, angle ABC = 70° and angle ACB = 50°. Given, O is the centre of the circle and PT is the tangent to the circle. Then calculate the following angles
(a) ∠CBT
(b) ∠BAT
(c) ∠PBT
(d) ∠APT
(a) Construct a triangle ABC such that BC = 8 cm, AC = 10 cm and ∠ABC = 90°.
(b) Construct an incircle to this triangle. Mark the centre as I.
(c) Measure and write the length of the in-radius.
(d) Measure and write the length of the tangents from vertex C to the incircle.
(e) Mark points P, Q and R where the incircle touches the sides AB, BC, and AC of the triangle respectively. Write the relationship between ∠RIQ and ∠QCR.
(Use a ruler and a compass for this question.)
A bag contains 13 red cards, 13 black cards and 13 green cards. Each set of cards are numbered 1 to 13. From these cards, a card is drawn at random. What is the probability that the card drawn is a:
(a) green card?
(b) a card with an even number?
(c) a red or black card with a number which is a multiple of three?