Mathematics
The following table shows the distribution of the marks obtained by 50 students in an aptitude test.
| Marks obtained | No. of students |
|---|---|
| 15 | 6 |
| 18 | 18 |
| 21 | 12 |
| 24 | 8 |
| 27 | 4 |
| 30 | 2 |
Find the mean, the median and the mode of the distribution.
Related Questions
For the inter-state supply of the following goods/services, find the amount of bill :
MRP (in ₹) GST % Discount % 2500 12 20 3000 18 30 4000 5 25 5000 12 40 Solve the quadratic equation x2 - 3(x + 3) = 0 and give your answer correct to two significant figures.
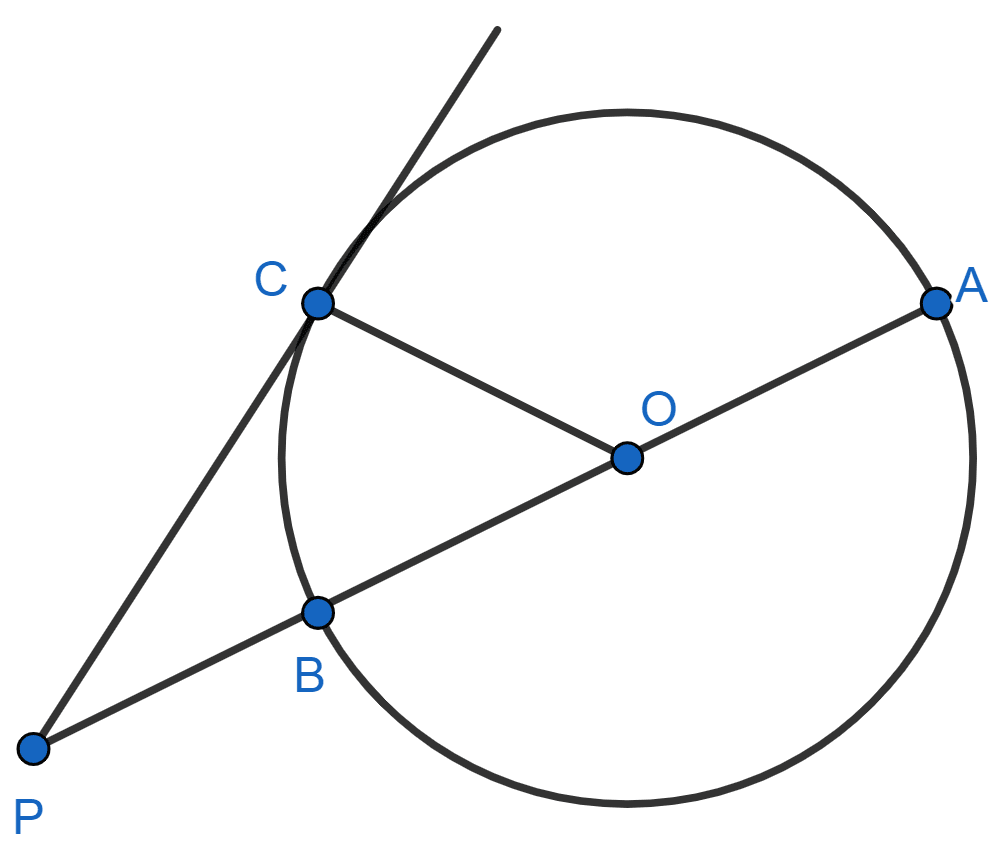
In the given figure, AB is diameter and PC is tangent to the circle with center O. If AP = 40 cm, CP = 20 cm, find the radius of the circle.