Mathematics
The following table shows the modes of transport used by boys and girls for going to the same school.
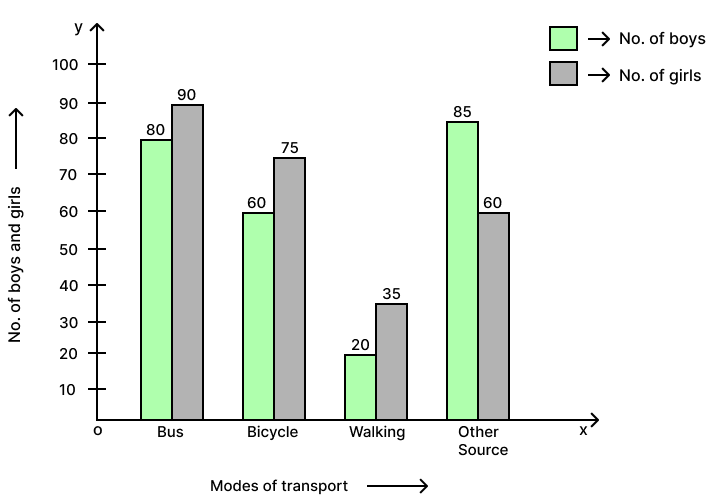
| Bus | Bicycle | Walking | Other sources | |
|---|---|---|---|---|
| Number of boys | 80 | 60 | 20 | 85 |
| Number of girls | 90 | 75 | 35 | 60 |
Draw a double bar graph representing the above data.
Answer
Steps:
On a graph paper, draw two mutually perpendicular lines OX and OY which intersect each other at point O.
The line OX is taken horizontal and is called the x-axis, whereas the line OY is taken vertical and is called the y-axis.
On the x-axis, starting from O, mark points at equal distances. At these points write the names of the modes of transport given. In this question, the names are Bus, Bicycle, Walking and Other sources.
Along y-axis, mark the heights of the bars (rectangles) in proportion to the given data (Number of boys and girls).
Remember:
(i) The heights of different bars (rectangles) are parallel to y-axis and the mid-points of their bases are on the points marked on the x-axis (step 2).
(ii) The bars may be taken of any suitable width, but widths of all the bars must be the same.
(iii) The space (distance) between consecutive bars may be of any suitable value, but the spaces between all the consecutive bars must be the same.
The required double bar graph is as given below:
Related Questions
For the data given above in question number 8, draw a suitable pie-graph.
Mr. Kapoor compares the prices (in ₹) of different items at two different shops A and B. Examine the following table carefully and represent the data by a double bar graph.
Items Price (in ₹) at shop A Price (in ₹) at shop B Tea-set 900 950 Mixer 700 800 Coffee-maker 600 700 Dinner set 600 500 The number of times a data, in the set, occurs is called :
upper-limit
class-mark
frequency
class-limit
The difference between the greatest and the smallest values of observations is called :
frequency
range
class-mark
class-limit